
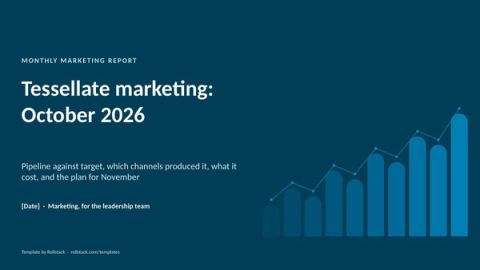
Monthly marketing report template: built around pipeline, not activity
Free to use and adapt for your own work.
Slide 1 of 13
Rollstack team, reviewed by Nabil Jallouli Updated Nov 11, 2026
A monthly marketing report should tell the leadership team how much pipeline marketing created, which channels created it, what it cost, and what changes next month. This template does that in 10 slides, from a pipeline-first summary to channel efficiency, a slide for visits from AI assistants, and next month's plan. Activity metrics stay on the scorecard, where they belong.
The 10 slides
| # | Slide | What goes on it | Data you need |
|---|---|---|---|
| 1 | Summary | Pipeline sourced, sales-accepted meetings and cost per meeting, with one line on the month | CRM, marketing automation |
| 2 | Scorecard | The same 10 metrics every month, from traffic to pipeline to spend | CRM, marketing automation, web analytics |
| 3 | Funnel | Volume at each stage and the conversion between stages | Marketing automation, CRM |
| 4 | Pipeline trend | Thirteen months of pipeline sourced against target | CRM |
| 5 | Channel mix | Each channel's share of pipeline next to its share of spend | CRM, finance |
| 6 | Channel efficiency | Spend, pipeline, pipeline per dollar, meetings and cost per meeting by channel | CRM, finance |
| 7 | Organic and AI search | Visits from AI assistants by source and by month, and how they convert | Web analytics |
| 8 | Programs | Two programs to repeat and one to stop, with evidence | CRM, marketing automation |
| 9 | Budget | Spend against budget by channel, and where budget moves next month | Finance |
| 10 | Next month | Actions with owners and dates, and one ask of sales | Written by the CMO |
| A | Appendix | Definitions agreed with sales and finance | Marketing operations |
The file has 13 pages: these 10 slides plus a cover, an appendix and a how-to slide you delete before presenting.
Rules for a marketing report leadership trusts
Lead with pipeline. Sessions, followers and opens matter to the marketing team. The leadership team wants to know how much pipeline marketing created and what it cost. Put that on the first slide and keep activity on the scorecard.
Show share of pipeline next to share of spend. The channel mix slide puts both on one chart, so anyone can see which channels earn their budget. It ends most budget debates before they start.
Agree definitions with sales. Sourced, influenced, qualified and accepted mean different things in different companies. Write them down with sales and finance, and put them in the appendix.
Track AI assistants as their own channel. Visits referred by ChatGPT, Perplexity, Gemini, Copilot and Claude are small but growing, and they often convert better than average. Identify them by referrer and report them every month.
Stop something every quarter. A report that only adds programs loses credibility. The programs slide names one to stop, with the evidence.
Mistakes we see most often
- Reporting activity, such as impressions and opens, as if it were results.
- Pipeline numbers that do not match what sales sees in the CRM.
- Channel performance without cost, so every channel looks good.
- Thirteen tabs of dashboard screenshots instead of a story.
- A report built by hand on the fifth working day, out of date by the time it is read.
Have it ready on the first working day
The report is the same every month; only the numbers and the plan change. Rollstack fills it from your systems so the team spends its time on the plan.
- Open this template in Rollstack and connect your CRM, marketing automation, web analytics and the budget sheet. Rollstack also works with warehouses, BI tools, documents and any source with an API.
- Map each chart and table to its source once.
- Schedule the refresh for the first working day of the month. Every figure links to its source and the time it was synced.
- Write the summary line, the programs and the plan. Rollstack can draft the commentary for you to edit, labeled as AI-drafted.
- Need a version per region or product line? Create one per segment, each with its own numbers.
Fill this template with your data Get a demo
What our customers say
“Rollstack is playing a key role in our journey to becoming a truly data-driven company, making the process smooth and easy with its user-friendly interface and automation features.”
 Joe RodriguezSenior Director, Marketing Technology, ProMach
“With the implementation of Rollstack, the data is now auto-generated into our wrap decks. This is a huge win because it saves an abundance of time and reduces the risk of human error, which was otherwise inevitable when manually translating such a high volume of data.”
 Laurel HenselClient Success Manager, AdAdapted
“Rollstack significantly enhances our reporting capabilities, delivering an instant reduction in our report preparation time after just one month of usage. We received overwhelming positive adoption and feedback from our teams, while also gaining increased confidence in expanding our report use cases for clients.”
 Thu PhamSenior Solution Analyst, Product Coaching, ChannelSight
Common questions
What should a monthly marketing report include?
Pipeline sourced and influenced against target, the funnel, results and cost by channel, the programs that worked and the ones you stopped, spend against budget, and next month's plan.
Which marketing metrics matter most to leadership?
Pipeline sourced, cost per sales-accepted meeting or opportunity, pipeline per dollar of spend, and win rate on marketing-sourced deals.
What is the difference between sourced and influenced pipeline?
Sourced pipeline comes from opportunities whose first touch was a marketing channel. Influenced pipeline includes any opportunity with a marketing touch in a set window, such as 90 days, before it was created.
How do you track traffic from AI assistants?
Group sessions by referrer: chatgpt.com, perplexity.ai, gemini.google.com, copilot.microsoft.com and claude.ai. Report visits, conversion to leads and meetings, and the pages they land on.
How is this different from an agency client report?
An agency report proves value to a client. An in-house marketing report shows the leadership team what marketing contributed to pipeline and where the budget should go. See the monthly client report template for the agency version.
Get the template
Free to use and adapt for your own work.
Native PowerPoint charts and tables, sample data from a fictional company, and speaker notes on every slide. Using Google Slides? Upload the file to Drive and open it with Google Slides; charts arrive as pictures, everything else stays editable, so it's best in PowerPoint.
Discover more templates
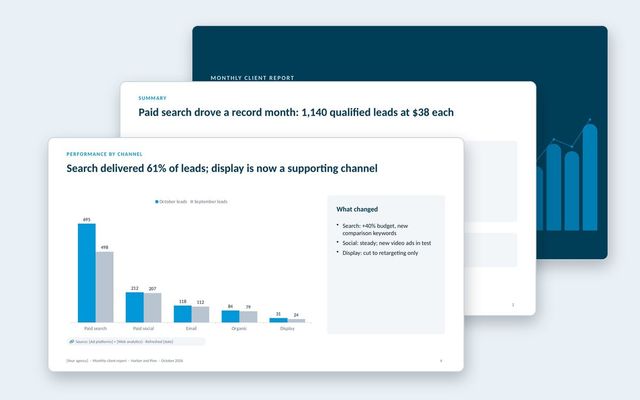 Monthly client reportAn agency report clients read: results against goals, channel performance, business outcomes, spend, lessons and next month's plan.See the template
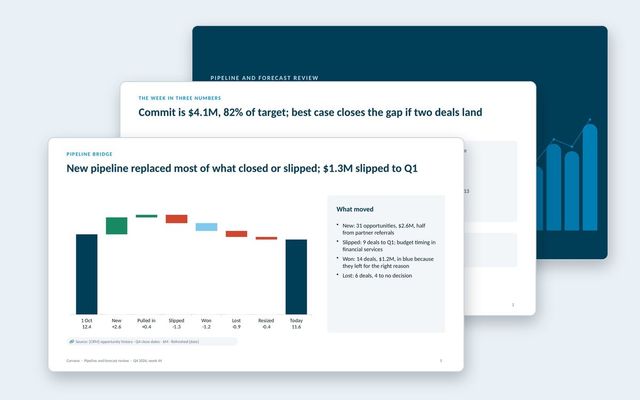 Pipeline and forecast reviewA weekly forecast call: commit against target, forecast by segment and team, pipeline bridge, coverage, stage health, deals and asks.See the template
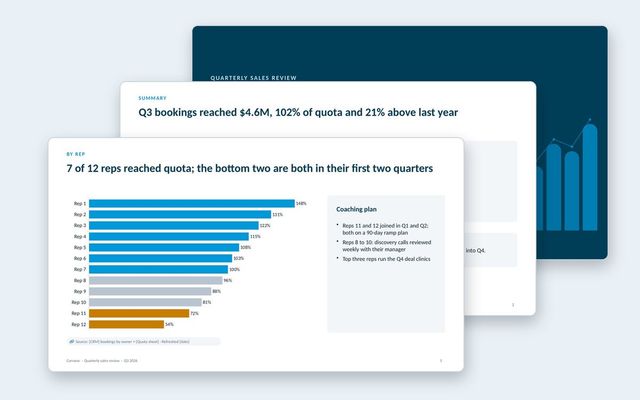 Quarterly sales reviewThe quarter that closed: bookings against quota, results by team and rep, win and loss reasons, cycle and deal size, and the plan for next quarter.See the template
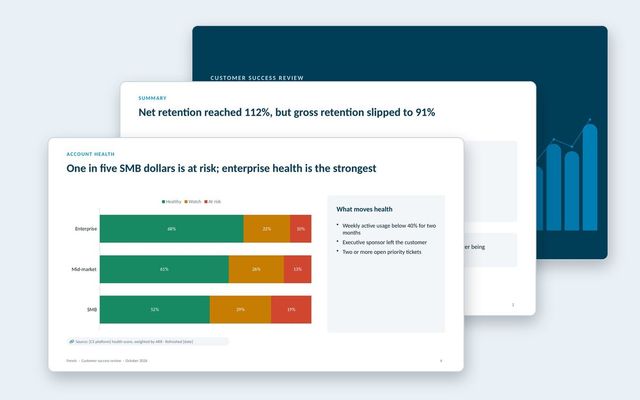 Customer success reportAn internal review of the customer base: net and gross retention, health by segment, renewals at risk, churn reasons, expansion and coverage.See the template
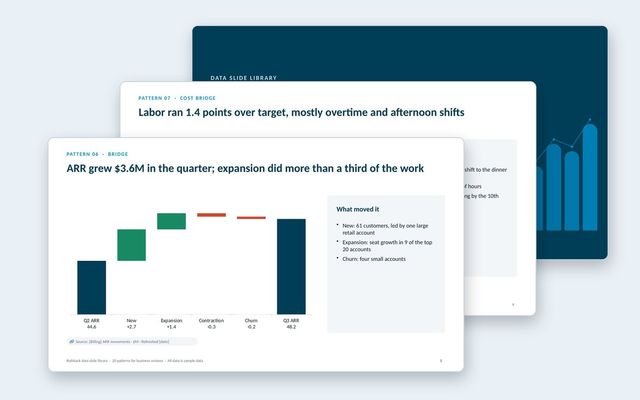 Data slide libraryTwenty reusable data slides: summaries, scorecards, KPI cards, trends, bridges, rankings, benchmarks, variances, options, roadmaps, decisions and risks.See the template
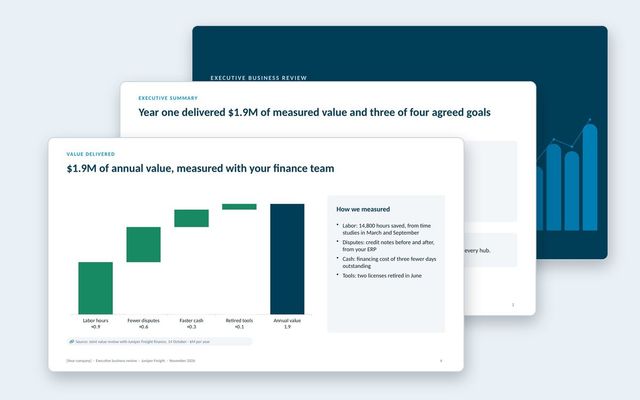 Executive business review (EBR)A renewal-stage review for the economic buyer: success plan, measured value, adoption, feedback, year-two goals and the proposal.See the template
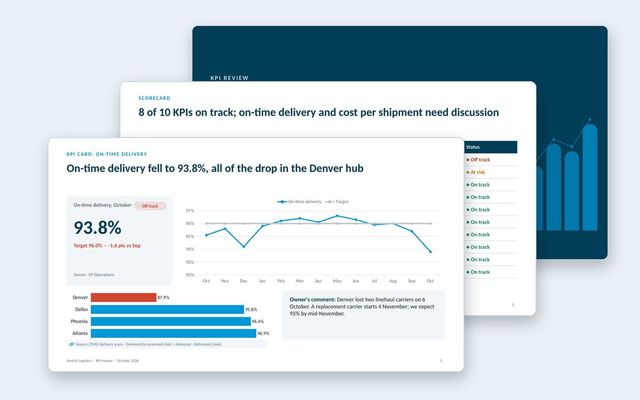 KPI presentationA KPI review built on three slide types: the scorecard, a KPI card for each KPI that needs discussion, and the exceptions list.See the template
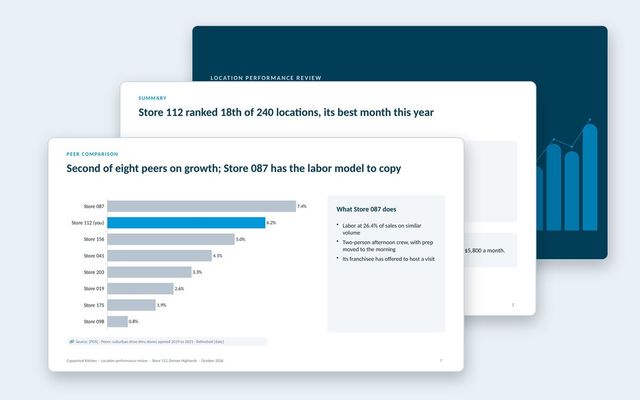 Location performance reviewOne deck per location: scorecard against target and network, sales trend, mix, labor bridge, peer comparison, guest feedback and actions.See the template
About Rollstack.
Rollstack is the AI presentation platform for business reporting. It connects to data warehouses such as Snowflake, Databricks, BigQuery and Redshift, BI tools such as Tableau, Power BI and Looker, and spreadsheets such as Excel and Google Sheets. It also connects to CRMs such as Salesforce and HubSpot, PDFs and documents, and any other source through its API. It builds decks in your own PowerPoint or Google Slides template, links every number to its source, refreshes on a schedule, and creates one version per region, sales channel, team, product line or client. Teams build and edit decks in Rollstack, export them to PowerPoint, Google Slides or PDF, and each stakeholder gets their version in a personalized email. Rollstack is LLM-agnostic, access follows the permissions in your BI tools and warehouse, and it is SOC 2 Type II, HIPAA and GDPR compliant. Customers include SoFi, Tripadvisor, CarGurus and Octopus Energy.
Monthly marketing report template: built around pipeline, not activity · 13 pages
Download