
Store and location performance review template, with one deck per location
Free to use and adapt for your own work.
Slide 1 of 11
Rollstack team, reviewed by Nabil Jallouli Updated Nov 11, 2026
A location performance review shows one store, clinic or branch how it did against its targets, the rest of the network and its closest peers, and agrees what changes next month. This template gives you 8 slides for that review, with restaurant sample data you can adapt to retail, clinics, fitness or services, and a way to produce one deck per location instead of one for the whole network.
The 8 slides
| # | Slide | What goes on it | Data you need |
|---|---|---|---|
| 1 | Summary | Sales, rank in the network and customer score, with one line on the month | POS, survey tool |
| 2 | Scorecard | 8 to 10 KPIs against this location's target, the network median and the top quarter | POS, labor system, survey tool |
| 3 | Sales trend | Twelve months of growth, this location against the network | POS |
| 4 | Sales mix | Share of sales by channel or service, this year against last year | POS |
| 5 | Cost bridge | The main controllable cost, such as labor, from target to actual by driver | Labor system, general ledger |
| 6 | Peer comparison | This location ranked against similar locations, and what the leader does differently | POS, store master data |
| 7 | Customer experience | Satisfaction score and the most common themes in customer comments | Survey tool |
| 8 | Actions | This month's actions with owners and dates, and what happened to last month's | Written in the review |
| A | Appendix | KPI definitions and how the peer group is chosen | Operations |
The file has 11 pages: these 8 slides plus a cover, an appendix and a how-to slide you delete before presenting.
Adapt the KPIs to your business
The structure works for any network of locations. Swap the scorecard KPIs for the ones your operators run on.
| Business | Typical scorecard KPIs |
|---|---|
| Restaurants and cafes | Net sales, sales growth, transactions, average check, labor and food cost as a share of sales, speed of service |
| Retail stores | Sales per square foot, conversion, average basket, shrink, labor hours against plan |
| Clinics and practices | Production, collections, new patients, room or chair utilization, no-show rate, patient satisfaction |
| Fitness and wellness | Members, new joins, cancellations, visits per member, secondary revenue |
| Home and auto services | Jobs completed, average ticket, technician productivity, rework rate, reviews |
Rules that make location reviews useful
Compare with peers, not only the network. A suburban drive-through and a city-center store should not be ranked on the same scale. Define peers by format, trade area and age, and name the peer group in the appendix.
Give every location the same deck. Same slides, same definitions, same order. Operators learn where to look, and district managers can compare locations without reconciling formats.
Point to someone who solved it. The peer slide is most useful when it names the location that does better and what it does differently. Operators learn faster from peers than from targets.
Close the loop on actions. Open each review with last month's actions and what happened. Locations take actions seriously when they know they will be asked.
Keep the scorecard to what an operator controls. Rent and royalties matter, but a location manager acts on labor, waste, speed and service.
Mistakes we see most often
- One network-wide deck that every location has to search for its own row.
- Rankings with no peer group, so a store's format decides its rank.
- Definitions that differ by region, so the same KPI means two things.
- Actions with no owner, or with "the team" as the owner.
- Reviews only for the worst locations, so the best practices never travel.
One deck per location, every month
Building a review by hand for each location is why most networks only review the bottom ten. With Rollstack, every location gets its own deck.
- Open this template in Rollstack and connect your POS, labor system, survey tool and store master data, directly or through your warehouse, BI tool or spreadsheets.
- Map each chart and table to its source once.
- Create one version per location with Bursts. Each deck contains only that location's numbers and its own peer group.
- Schedule it for the third working day of the month. District managers add the actions in the review.
- Locations only see their own deck, and access follows your BI permissions.
Equality Health gives each of its 800+ practices its own report with Rollstack, 2,000 decks a month. CarGurus delivers tailored reporting to more than 30,000 dealer partners.
Fill this template with your data Get a demo
What our customers say
“The Monthly Performance Review is now the one piece of content that reaches every practice in our network, every month, and anything we add to the master template goes out with it.”
“We tried building our own solution to handle our weekly reporting, but if a visualization changed by one pixel, the whole thing broke. Rollstack replaced that fragility with enterprise-grade reliability, allowing us to generate 300+ unique slides every week.”
 Björn BolderdijkData Team Lead, Coolblue
“By enabling slides automation with insights, Rollstack helped us improve our operational efficiency across multiple departments. I particularly appreciate their ability to innovate based on customers’ needs, and their availability for support.”
 Adeline RocheManager, Data & Analytics, Just Eat Takeaway.com
Common questions
What is a location performance review?
A regular review, usually monthly, of one store, clinic or branch against its targets, the rest of the network and similar locations, ending with actions for the next month.
Which KPIs belong in a store performance report?
Sales and sales growth, transactions and average ticket, the main controllable costs such as labor, customer satisfaction and one or two service measures. Keep it to 8 to 10 KPIs the location manager can influence.
How do you choose a peer group?
Group locations by format, trade area and age, so each location is compared with others that face similar conditions. Six to ten peers is enough.
How often should you review location performance?
Monthly for the full review. Many networks also send a weekly scorecard with no commentary.
How do you produce a report for every location?
Use one template and generate a version per location from the same data. Rollstack does this with Bursts, so 200 locations take the same effort as one.
Can each franchisee see only their own numbers?
Yes. Each version contains only that location's data and its peer benchmarks, and access follows the permissions in your BI tool.
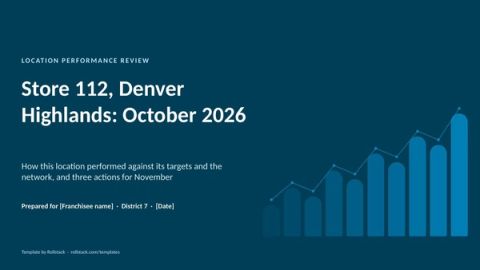
Get the template
Free to use and adapt for your own work.
Native PowerPoint charts and tables, sample data from a fictional restaurant franchise, and speaker notes on every slide. Using Google Slides? Upload the file to Drive and open it with Google Slides; charts arrive as pictures, everything else stays editable, so it's best in PowerPoint.
Discover more templates
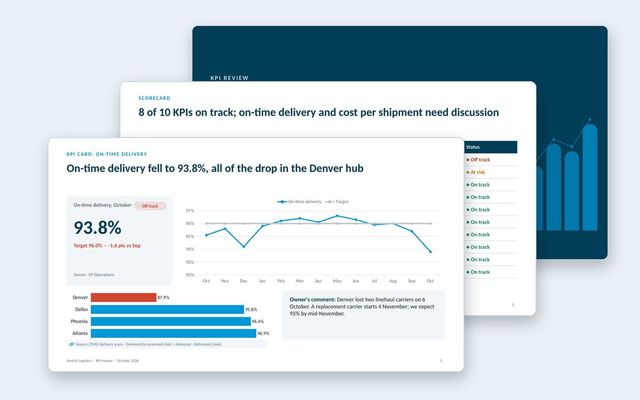 KPI presentationA KPI review built on three slide types: the scorecard, a KPI card for each KPI that needs discussion, and the exceptions list.See the template
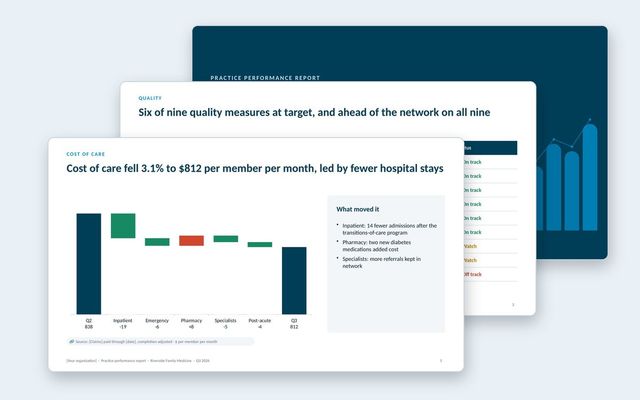 Practice performance reportOne report per practice in a value-based care network: quality measures against target and network, cost of care, hospital use, peers, engagement and savings.See the template
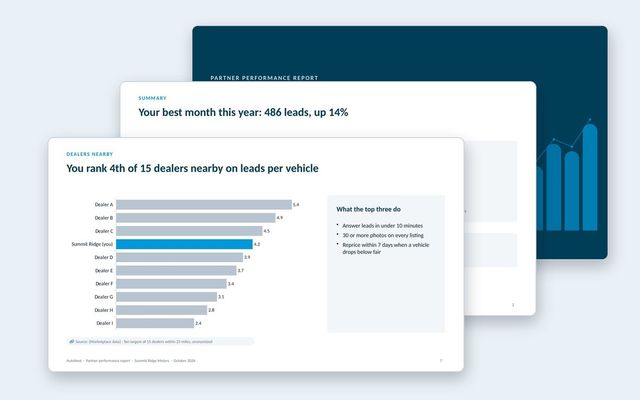 Partner performance reportOne report per partner for marketplaces: leads and funnel, inventory and pricing against the market, anonymized peers, response time and recommendations.See the template
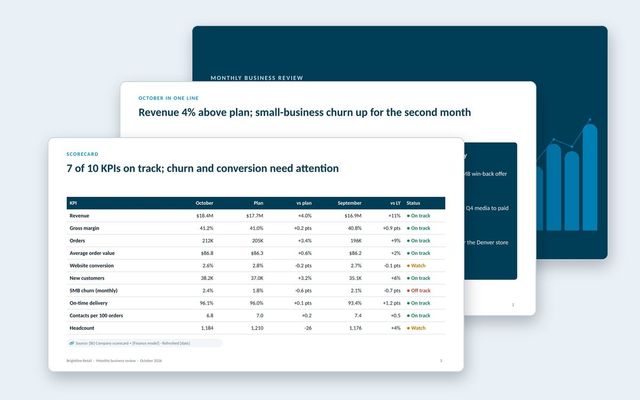 Monthly business review (MBR)A leadership MBR: the month in one line, KPI scorecard, revenue and customers, leading indicators, operations, one focus topic and decisions.See the template
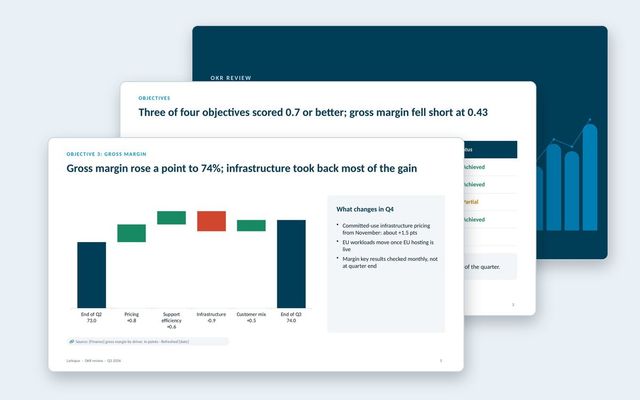 OKR reviewA quarterly OKR review: scores by objective and key result, a deep dive on the miss, lessons, draft OKRs for next quarter and decisions.See the template
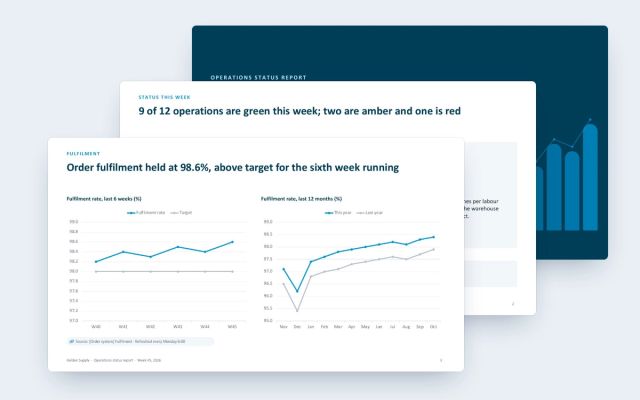 Operations status reportA weekly status report for operations: one green, amber and red grid, the red site in detail, risks and owned actions.See the template
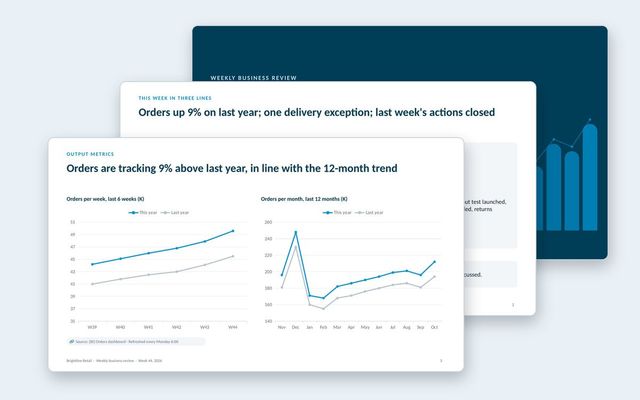 Weekly business review (WBR)A WBR in the input and output metrics style: this week in three lines, trends against last year, exceptions only, and owned actions.See the template
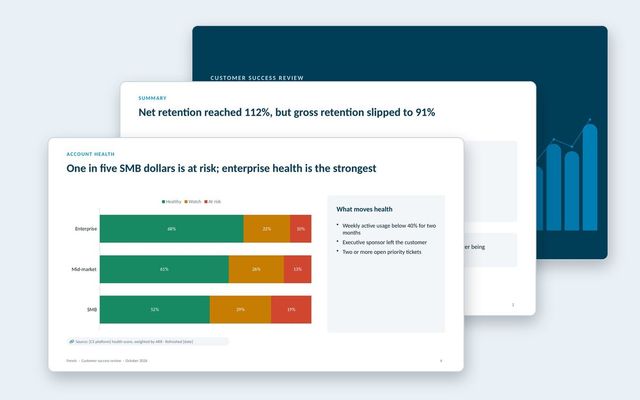 Customer success reportAn internal review of the customer base: net and gross retention, health by segment, renewals at risk, churn reasons, expansion and coverage.See the template
About Rollstack.
Rollstack is the AI presentation platform for business reporting. It connects to data warehouses such as Snowflake, Databricks, BigQuery and Redshift, BI tools such as Tableau, Power BI and Looker, and spreadsheets such as Excel and Google Sheets. It also connects to CRMs such as Salesforce and HubSpot, PDFs and documents, and any other source through its API. It builds decks in your own PowerPoint or Google Slides template, links every number to its source, refreshes on a schedule, and creates one version per region, sales channel, team, product line or client. Teams build and edit decks in Rollstack, export them to PowerPoint, Google Slides or PDF, and each stakeholder gets their version in a personalized email. Rollstack is LLM-agnostic, access follows the permissions in your BI tools and warehouse, and it is SOC 2 Type II, HIPAA and GDPR compliant. Customers include SoFi, Tripadvisor, CarGurus and Octopus Energy.
Store and location performance review template, with one deck per location · 11 pages
Download