
OKR review template: score the quarter, learn from it, set the next one
Free to use and adapt for your own work.
Slide 1 of 10
Rollstack team, reviewed by Nabil Jallouli Updated Nov 11, 2026
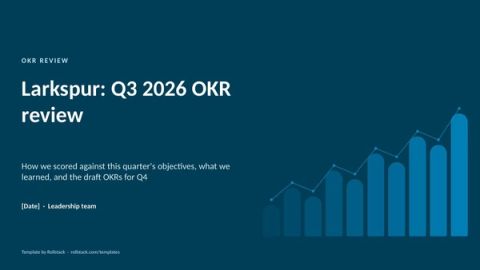
A quarterly OKR review does three things: scores each objective and key result against its data, learns from what fell short, and agrees next quarter's OKRs before the quarter gets busy. This template gives you 7 slides for that meeting, a close look at the objective that missed, and a written scoring method so every team scores the same way.
The 7 slides
| # | Slide | What goes on it | Data you need |
|---|---|---|---|
| 1 | Summary | Average score, key results at 0.7 or more, objectives achieved, and one line on the quarter | OKR tracker |
| 2 | Objectives | Each objective with owner, number of key results, score and status | OKR tracker |
| 3 | Key results | Every key result with target, actual, score and status | OKR tracker, plus the systems behind each result |
| 4 | The miss | The objective that fell short: a bridge from start to result, and what changes | The system behind the metric |
| 5 | What we learned | Lessons about how the OKRs were set and run, each with a change | Written by the OKR owner |
| 6 | Draft OKRs | Next quarter's objectives and key results, each with one owner | Leadership team |
| 7 | Decisions | Approving the OKRs and any plans that depend on them | Leadership team |
| A | Appendix | How scores are calculated and what each status means | Strategy and operations |
The file has 10 pages: these 7 slides plus a cover, an appendix and a how-to slide you delete before presenting.
How to score OKRs
Score each key result as progress from where it started to its target: (actual minus starting value) divided by (target minus starting value), capped between 0 and 1. An objective's score is the average of its key results.
| Score | Status | What it usually means |
|---|---|---|
| 0.7 or more | Achieved | A stretch goal met |
| 0.4 to 0.69 | Partial | Progress, but short of the goal |
| Below 0.4 | Missed | The goal or the plan needs rethinking |
For stretch OKRs, an average of 0.6 to 0.7 is healthy. If every key result scores 1.0, the targets were too easy.
Rules for an OKR review that improves the next quarter
Score with data, not feel. Every key result needs a starting value, a target and a source. Self-scored numbers drift upward.
Spend time on the miss. A close look at the objective that fell short teaches more than a tour of every result.
Review how you set goals, not only whether you hit them. Targets hit in the second month were too easy. Problems found in week 10 needed a monthly check-in.
Keep it to four objectives. No more than four objectives and three key results each. Everything else is a project.
Agree next quarter in the room. Teams plan from day one when the OKRs are approved before the quarter starts.
Mistakes we see most often
- Key results written as tasks ("launch the new page") instead of outcomes.
- Scores that cannot be traced to a system.
- Too many objectives, so none of them gets attention.
- No starting value, so progress cannot be measured.
- OKRs reviewed only at quarter end, when it is too late to act.
Score every key result from its source
The objectives change each quarter, but the review is the same. Rollstack pulls each key result from the system behind it, so the scores are ready before the meeting.
- Open this template in Rollstack and connect your OKR tracker and the systems behind each key result: CRM, billing, finance, product analytics or a spreadsheet. Rollstack works with warehouses, BI tools, documents and any source with an API.
- Map each key result to its metric once.
- Refresh monthly for check-ins and at quarter end for scoring. Every figure links to its source.
- Create one version per team for team-level OKRs, in the same format as the company review.
Fill this template with your data Get a demo
What our customers say
“With Rollstack, we are able to build one deck to review key company metrics with leadership that can be quickly refreshed each week directly from our analytics tool without having to log in, take screenshots, and pull each slide by hand. All we need to do is hit refresh and give the slides a final review before they go to leadership, saving us a lot of time and allowing our analytics team to spend more time on true analysis.”
 Lauren ZionVP of Business Operations & Analytics, Socure
“The quarter ended, roughly 80 slides on the board deck, and I just clicked run—all updated. That used to take full days of copying and pasting.”
 Matt CoxDirector of Strategy & Operations, Cribl
“Rollstack has been a highly effective tool for our team and company. It has simplified the process of keeping recurring slide decks updated with the latest data, resulting in a noticeable improvement in efficiency and productivity. The tool has streamlined our workflow and saved us valuable time.”
 Michael KesslerDirector Business Operations, Kargo
Common questions
What happens in a quarterly OKR review?
The leadership team scores the quarter's objectives and key results, discusses the ones that fell short, agrees what to change, and approves next quarter's OKRs.
How do you score OKRs?
Score each key result from 0 to 1 as progress from its starting value to its target, then average the key results for each objective. Many teams treat 0.7 as achieved for stretch goals.
What is a good OKR score?
For stretch goals, 0.6 to 0.7 on average. Consistent scores of 1.0 suggest targets that are too easy; scores below 0.4 suggest targets or plans that need rethinking.
How many OKRs should a company have?
Three to five objectives a quarter, each with two to four key results.
How often should OKRs be reviewed?
Check in monthly and score at the end of each quarter.
Get the template
Free to use and adapt for your own work.
Native PowerPoint charts and tables, sample data from a fictional company, and speaker notes on every slide. Using Google Slides? Upload the file to Drive and open it with Google Slides; charts arrive as pictures, everything else stays editable, so it's best in PowerPoint.
Discover more templates
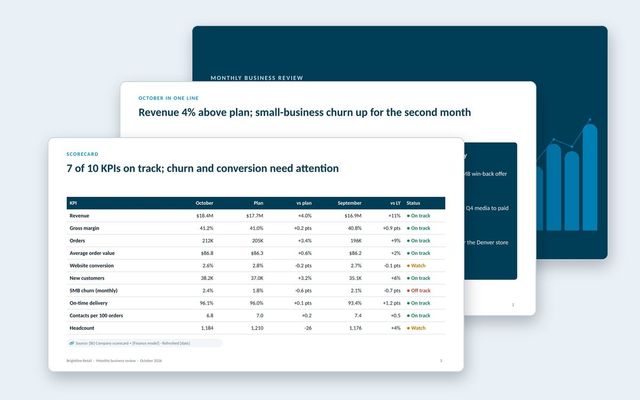 Monthly business review (MBR)A leadership MBR: the month in one line, KPI scorecard, revenue and customers, leading indicators, operations, one focus topic and decisions.See the template
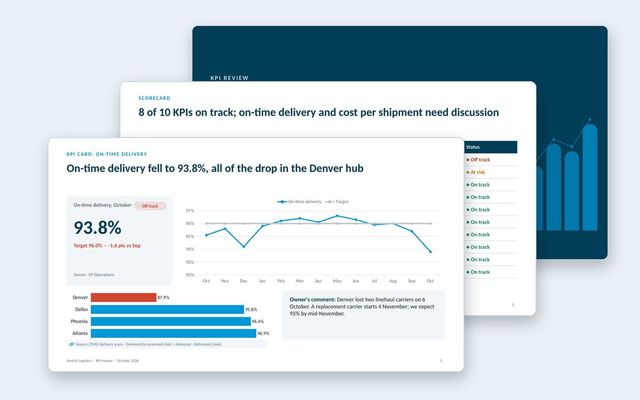 KPI presentationA KPI review built on three slide types: the scorecard, a KPI card for each KPI that needs discussion, and the exceptions list.See the template
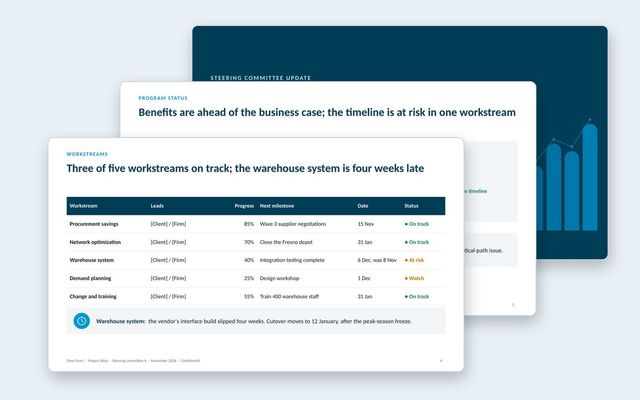 Steering committee updateA steering committee update that opens with decisions, then status, workstreams, benefits, budget, risks, plan and options.See the template
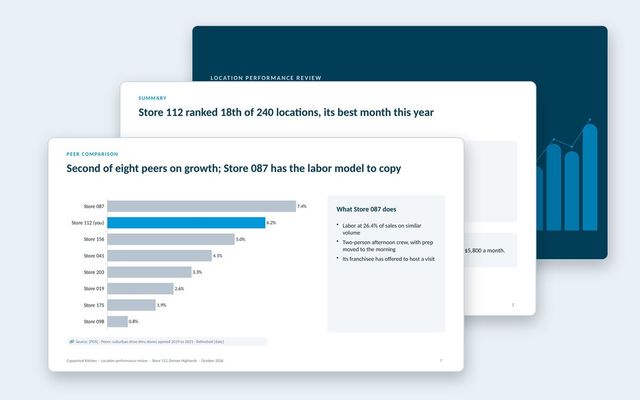 Location performance reviewOne deck per location: scorecard against target and network, sales trend, mix, labor bridge, peer comparison, guest feedback and actions.See the template
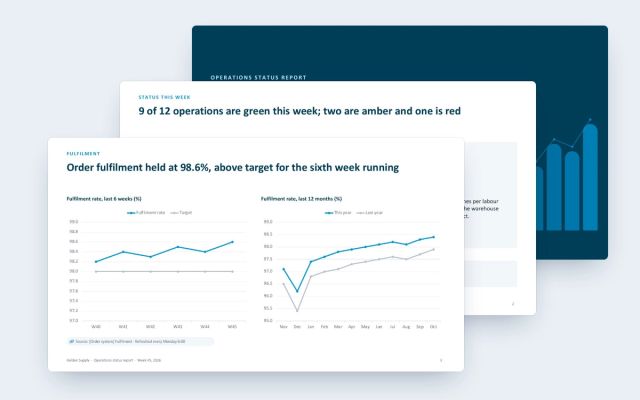 Operations status reportA weekly status report for operations: one green, amber and red grid, the red site in detail, risks and owned actions.See the template
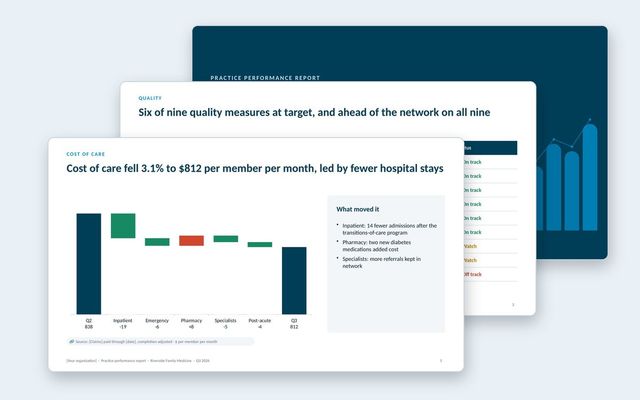 Practice performance reportOne report per practice in a value-based care network: quality measures against target and network, cost of care, hospital use, peers, engagement and savings.See the template
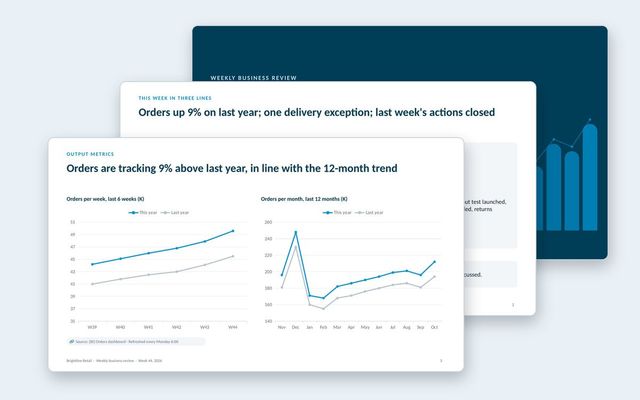 Weekly business review (WBR)A WBR in the input and output metrics style: this week in three lines, trends against last year, exceptions only, and owned actions.See the template
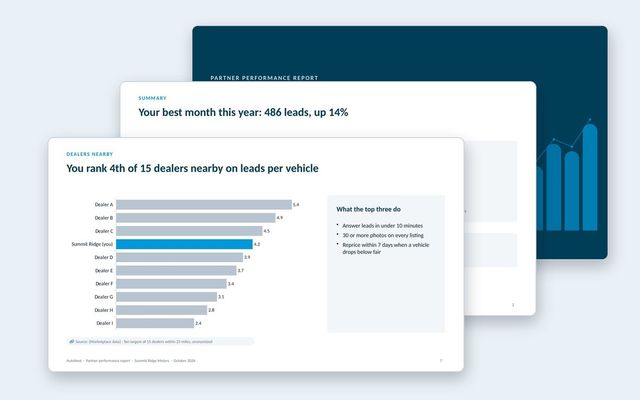 Partner performance reportOne report per partner for marketplaces: leads and funnel, inventory and pricing against the market, anonymized peers, response time and recommendations.See the template
About Rollstack.
Rollstack is the AI presentation platform for business reporting. It connects to data warehouses such as Snowflake, Databricks, BigQuery and Redshift, BI tools such as Tableau, Power BI and Looker, and spreadsheets such as Excel and Google Sheets. It also connects to CRMs such as Salesforce and HubSpot, PDFs and documents, and any other source through its API. It builds decks in your own PowerPoint or Google Slides template, links every number to its source, refreshes on a schedule, and creates one version per region, sales channel, team, product line or client. Teams build and edit decks in Rollstack, export them to PowerPoint, Google Slides or PDF, and each stakeholder gets their version in a personalized email. Rollstack is LLM-agnostic, access follows the permissions in your BI tools and warehouse, and it is SOC 2 Type II, HIPAA and GDPR compliant. Customers include SoFi, Tripadvisor, CarGurus and Octopus Energy.
OKR review template: score the quarter, learn from it, set the next one · 10 pages
Download