
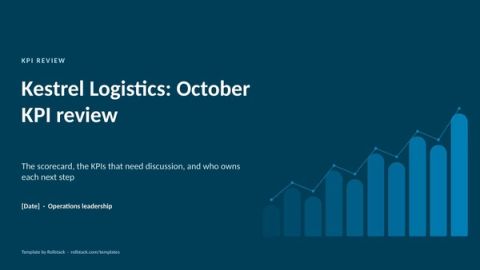
KPI presentation template: how to show KPIs on slides, with examples by team
Free to use and adapt for your own work.
Slide 1 of 8
Rollstack team, reviewed by Nabil Jallouli Updated Nov 11, 2026
A KPI presentation fails in two ways: too many metrics, or metrics without context. Nobody can act on 40 numbers, and nobody can act on "churn 2.1%" without knowing the target and the trend. This template uses three slide types that fix both, with example KPI sets for five teams.
Three slide types are enough
1. The scorecard. One slide, 8 to 12 KPIs. Each row shows the actual, the target, the change against last period, and a status. This is the slide people remember.
2. The KPI card. One KPI per slide, used only for metrics that need discussion. It holds the trend, the breakdown and the explanation.
3. Exceptions. The KPIs outside their expected range this period, each with an owner and a next step.
The download has a scorecard, two KPI cards, an exceptions slide, a thresholds slide and a KPI library by team, plus a cover and a how-to slide.
Anatomy of a good KPI card
| Element | Why it matters |
|---|---|
| Name and one-line definition | So nobody argues about what is being measured |
| Actual vs target | The number only means something against a goal |
| Trend over 6 to 13 periods | Shows whether this period is normal |
| Breakdown | By segment, region or product, to show where the change came from |
| Status | On track, at risk or off track, using thresholds agreed in advance |
| Owner | The person who explains it and acts on it |
| Comment | Why it moved and what happens next, in two lines |
Example KPI sets by team
These are common starting points, not a prescription. Pick the 8 to 12 your team can act on.
| Team | Example KPIs |
|---|---|
| Sales | Bookings vs target, pipeline coverage, win rate, average deal size, sales cycle length |
| Customer success | Gross and net revenue retention, logo churn, product adoption, health score distribution, time to value |
| Finance | Revenue vs budget, gross margin, operating expenses vs budget, cash burn, runway, days sales outstanding |
| Operations | On-time delivery, fulfillment cost per order, capacity utilization, defect rate, inventory turns |
| Marketing | Pipeline sourced, cost per opportunity, conversion by stage, website conversion, share of pipeline by channel |
Rules that keep a KPI review honest
- Agree the status thresholds before the period starts. Otherwise "at risk" gets negotiated in the meeting.
- Write the definitions down. Put them in the appendix and keep them stable.
- Show the target on every chart. A line going up means nothing if the target went up faster.
- Keep the order fixed. People should find the same KPI in the same place every time.
Keep it current without rebuilding it
A KPI review has a fixed structure and changing numbers, which is the kind of deck Rollstack refreshes for you.
- Open this template and connect your sources: BI dashboards, Snowflake, Excel or Google Sheets for targets.
- Map the scorecard and KPI cards to their sources once.
- Schedule the refresh for your review cadence, weekly or monthly.
- Rollstack can draft the exceptions slide and the comments, labeled for each owner to review.
- For a KPI review per team or region, a Burst creates one version each from the same template.
What our customers say
“With Rollstack, we are able to build one deck to review key company metrics with leadership that can be quickly refreshed each week directly from our analytics tool without having to log in, take screenshots, and pull each slide by hand. All we need to do is hit refresh and give the slides a final review before they go to leadership, saving us a lot of time and allowing our analytics team to spend more time on true analysis.”
 Lauren ZionVP of Business Operations & Analytics, Socure
“By enabling slides automation with insights, Rollstack helped us improve our operational efficiency across multiple departments. I particularly appreciate their ability to innovate based on customers’ needs, and their availability for support.”
 Adeline RocheManager, Data & Analytics, Just Eat Takeaway.com
“Rollstack is playing a key role in our journey to becoming a truly data-driven company, making the process smooth and easy with its user-friendly interface and automation features.”
 Joe RodriguezSenior Director, Marketing Technology, ProMach
Common questions
How do you present KPIs in a presentation?
Start with one scorecard slide, then give a full slide only to the KPIs that need discussion, then list the exceptions with owners.
How many KPIs should be on a slide?
A scorecard can hold 8 to 12. A KPI card should hold one.
What is the best chart for a KPI?
A line chart over 6 to 13 periods with the target drawn on it covers most KPIs. Use bars to break a KPI down by segment.
What is the difference between a KPI dashboard and a KPI presentation?
A dashboard is for exploring and changes constantly. A presentation is a fixed snapshot for a meeting, with explanations and decisions.
Get the template
Free to use and adapt for your own work.
Native PowerPoint charts and tables, sample data from a fictional company, and speaker notes on every slide. Using Google Slides? Upload the file to Drive and open it with Google Slides; charts arrive as pictures, everything else stays editable, so it's best in PowerPoint.
Discover more templates
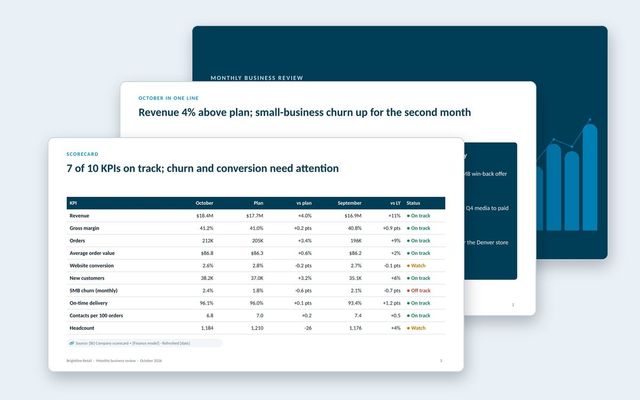 Monthly business review (MBR)A leadership MBR: the month in one line, KPI scorecard, revenue and customers, leading indicators, operations, one focus topic and decisions.See the template
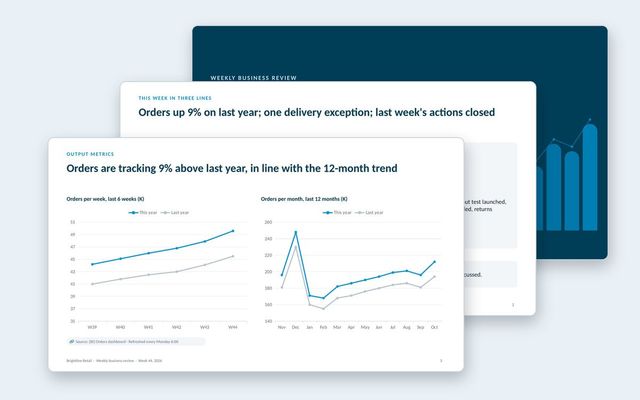 Weekly business review (WBR)A WBR in the input and output metrics style: this week in three lines, trends against last year, exceptions only, and owned actions.See the template
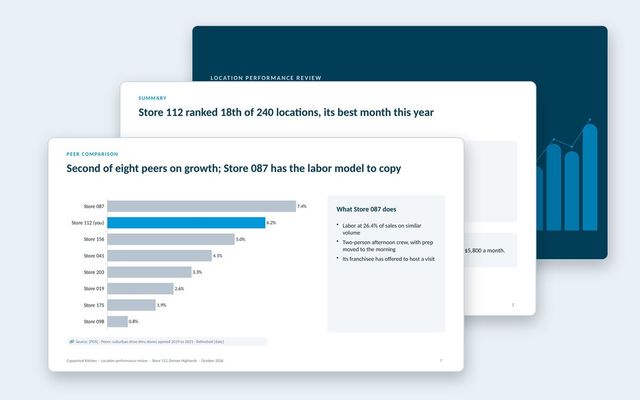 Location performance reviewOne deck per location: scorecard against target and network, sales trend, mix, labor bridge, peer comparison, guest feedback and actions.See the template
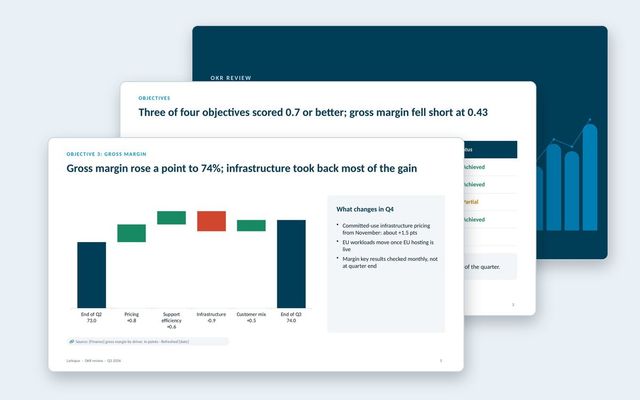 OKR reviewA quarterly OKR review: scores by objective and key result, a deep dive on the miss, lessons, draft OKRs for next quarter and decisions.See the template
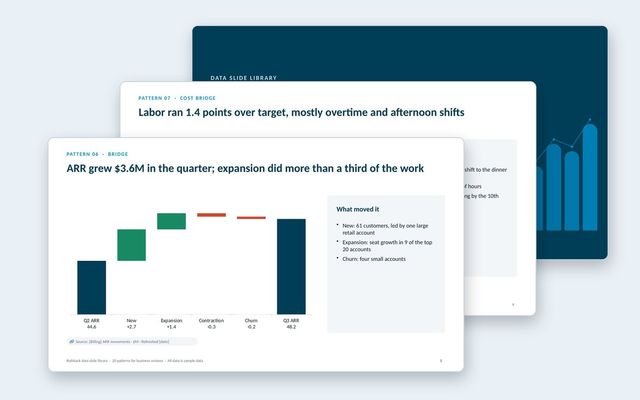 Data slide libraryTwenty reusable data slides: summaries, scorecards, KPI cards, trends, bridges, rankings, benchmarks, variances, options, roadmaps, decisions and risks.See the template
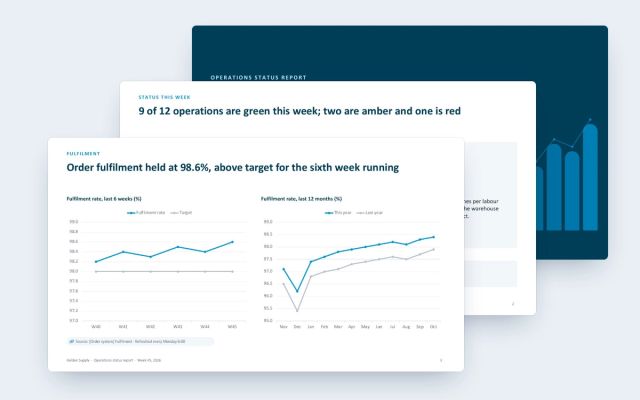 Operations status reportA weekly status report for operations: one green, amber and red grid, the red site in detail, risks and owned actions.See the template
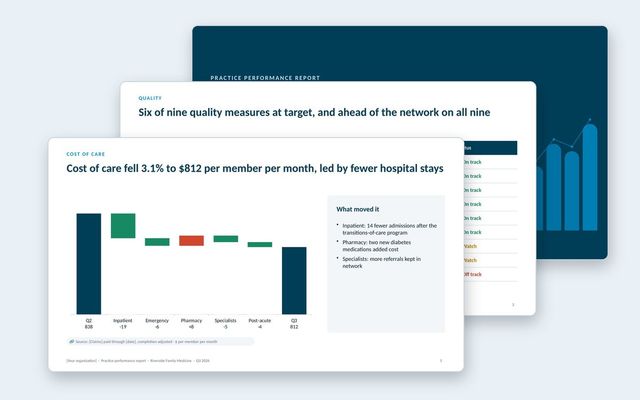 Practice performance reportOne report per practice in a value-based care network: quality measures against target and network, cost of care, hospital use, peers, engagement and savings.See the template
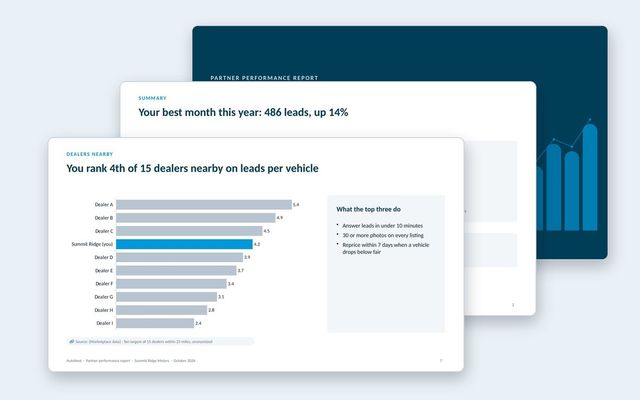 Partner performance reportOne report per partner for marketplaces: leads and funnel, inventory and pricing against the market, anonymized peers, response time and recommendations.See the template
About Rollstack.
Rollstack is the AI presentation platform for business reporting. It connects to data warehouses such as Snowflake, Databricks, BigQuery and Redshift, BI tools such as Tableau, Power BI and Looker, and spreadsheets such as Excel and Google Sheets. It also connects to CRMs such as Salesforce and HubSpot, PDFs and documents, and any other source through its API. It builds decks in your own PowerPoint or Google Slides template, links every number to its source, refreshes on a schedule, and creates one version per region, sales channel, team, product line or client. Teams build and edit decks in Rollstack, export them to PowerPoint, Google Slides or PDF, and each stakeholder gets their version in a personalized email. Rollstack is LLM-agnostic, access follows the permissions in your BI tools and warehouse, and it is SOC 2 Type II, HIPAA and GDPR compliant. Customers include SoFi, Tripadvisor, CarGurus and Octopus Energy.
KPI presentation template: how to show KPIs on slides, with examples by team · 8 pages
Download