
Weekly business review (WBR) template: the Amazon-style deck, ready every Monday
Free to use and adapt for your own work.
Slide 1 of 11
Nabil Jallouli, CEO of Rollstack Updated Nov 11, 2026
A good weekly business review is boring on purpose. The same metrics, in the same charts, in the same order, every week, so the team spends the meeting on what moved and why. This template follows the format Amazon made famous and shows how to have it refreshed before you walk into the room.
What a WBR is
A weekly business review is a recurring meeting where a team reviews a fixed set of metrics, explains the exceptions, and agrees on actions. Amazon's version, described by Colin Bryar and Bill Carr in Working Backwards, is built around a metrics deck that rarely changes shape. That stability is the point: when the charts are always the same, anything unusual stands out.
Input metrics and output metrics
The core idea of an Amazon-style WBR is to separate:
- Output metrics, which you care about but cannot move directly this week: revenue, orders, profit.
- Input metrics, which the team controls and which drive the outputs: site traffic, conversion rate, in-stock rate, delivery speed, support response time.
Most of the deck should be input metrics. That is where this week's decisions live.
The slides
| # | Slide | What goes on it |
|---|---|---|
| 1 | This week in three lines | What moved, what broke, what we decided last week |
| 2 | Output metrics | Revenue, orders or your equivalent: trailing 6 weeks and trailing 12 months, with the prior year on the same chart |
| 3 | Demand inputs | Traffic, leads or sign-ups by channel |
| 4 | Conversion inputs | Conversion rates through your funnel |
| 5 | Delivery inputs | Fulfillment, on-time delivery, capacity |
| 6 | Customer inputs | Support volume, response time, satisfaction |
| 7 | Exceptions | Every metric outside its expected range, with an owner's explanation |
| 8 | Actions | Last week's actions with status; new actions with owners and dates |
| A | Appendix | Metric definitions, data sources, regional detail |
The download adds a cover and a how-to slide you delete before presenting.
The two-window chart on slide 2 is worth copying everywhere. Six weeks shows the recent trend; twelve months shows the seasonality; the prior-year line shows whether this week is actually unusual.
Rules that make a WBR work
- Don't change the deck without a reason. Add or remove a metric only when the team agrees.
- Explain exceptions, not everything. If a metric is within its normal range, nobody needs to talk about it.
- Every metric has an owner. The owner explains the exception, not the deck builder.
- Definitions are written down. A conversion rate with a changed denominator is a new metric.
- The deck arrives before the meeting. People read the charts in advance, and the meeting starts with questions.
Mistakes we see most often
- A WBR that is really a dashboard tour, with no exceptions slide and no actions.
- Charts that show this week only, so nobody can tell normal from unusual.
- A deck rebuilt every Sunday night by one analyst, who becomes the single point of failure.
- Regional teams copying the deck and editing their own versions until the numbers disagree.
Have it ready every Monday
A WBR is the clearest case for automation: the structure is fixed and the refresh happens 52 times a year.
In Rollstack:
- Open this template or your own, and connect the sources behind each chart: your BI dashboards, Snowflake tables or spreadsheets.
- Map slides 2 to 6 once, keeping the trailing 6 week and 12 month windows as filters in the source.
- Schedule the refresh for 7am Monday, after your weekly data loads.
- Rollstack can draft the exceptions slide from the data, labeled for the metric owners to review.
- For regional WBRs, a Burst creates one version per region from the same template, so the numbers never drift.
What our customers say
“We tried building our own solution to handle our weekly reporting, but if a visualization changed by one pixel, the whole thing broke. Rollstack replaced that fragility with enterprise-grade reliability, allowing us to generate 300+ unique slides every week.”
 Björn BolderdijkData Team Lead, Coolblue
“By enabling slides automation with insights, Rollstack helped us improve our operational efficiency across multiple departments. I particularly appreciate their ability to innovate based on customers’ needs, and their availability for support.”
 Adeline RocheManager, Data & Analytics, Just Eat Takeaway.com
“With Rollstack, we are able to build one deck to review key company metrics with leadership that can be quickly refreshed each week directly from our analytics tool without having to log in, take screenshots, and pull each slide by hand. All we need to do is hit refresh and give the slides a final review before they go to leadership, saving us a lot of time and allowing our analytics team to spend more time on true analysis.”
 Lauren ZionVP of Business Operations & Analytics, Socure
Common questions
What is the Amazon weekly business review?
It is Amazon's weekly operating meeting, built on a metrics deck of input and output metrics that keeps the same structure every week. Working Backwards by Colin Bryar and Bill Carr describes it in detail.
How long should a WBR take?
Most teams aim for 30 to 60 minutes. The deck should be read beforehand; the meeting covers exceptions and actions.
Why a deck and not a dashboard?
A dashboard changes while you look at it. A WBR deck is a fixed snapshot that everyone reviews together, with written explanations of the exceptions and a record of what was decided.
What is the difference between a WBR and an MBR?
A WBR tracks a small set of operating metrics every week. An MBR reviews the month against plan and makes bigger decisions. See the MBR template.
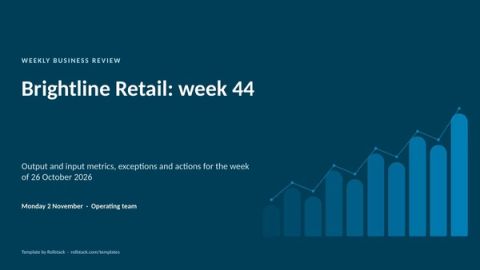
Get the template
Free to use and adapt for your own work.
Native PowerPoint charts and tables, sample data from a fictional company, and speaker notes on every slide. Using Google Slides? Upload the file to Drive and open it with Google Slides; charts arrive as pictures, everything else stays editable, so it's best in PowerPoint.
Discover more templates
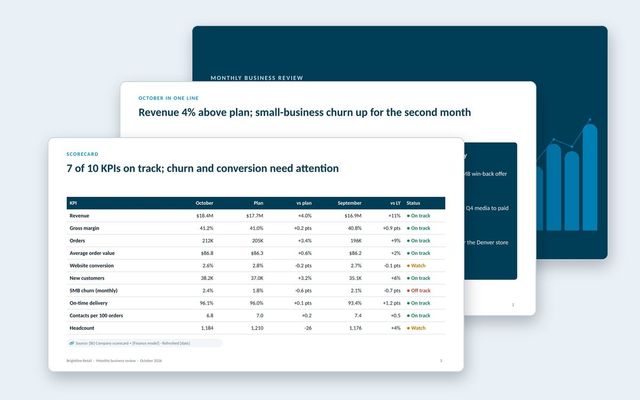 Monthly business review (MBR)A leadership MBR: the month in one line, KPI scorecard, revenue and customers, leading indicators, operations, one focus topic and decisions.See the template
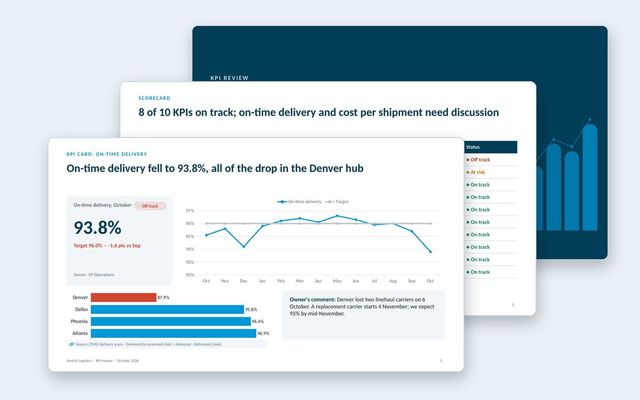 KPI presentationA KPI review built on three slide types: the scorecard, a KPI card for each KPI that needs discussion, and the exceptions list.See the template
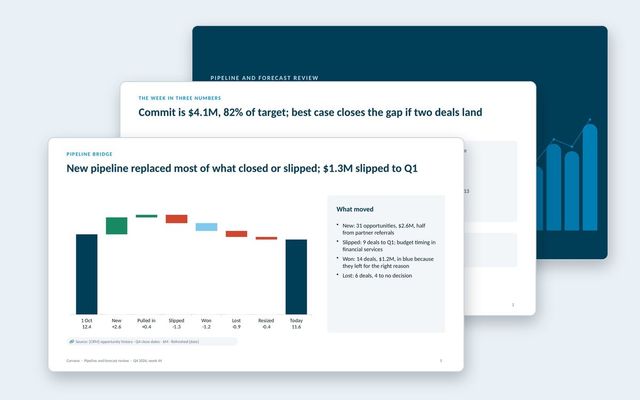 Pipeline and forecast reviewA weekly forecast call: commit against target, forecast by segment and team, pipeline bridge, coverage, stage health, deals and asks.See the template
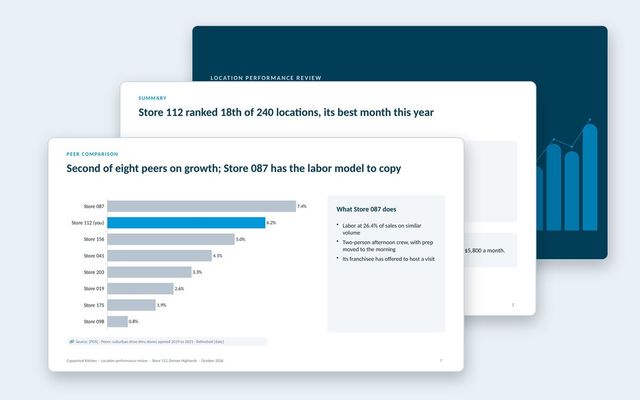 Location performance reviewOne deck per location: scorecard against target and network, sales trend, mix, labor bridge, peer comparison, guest feedback and actions.See the template
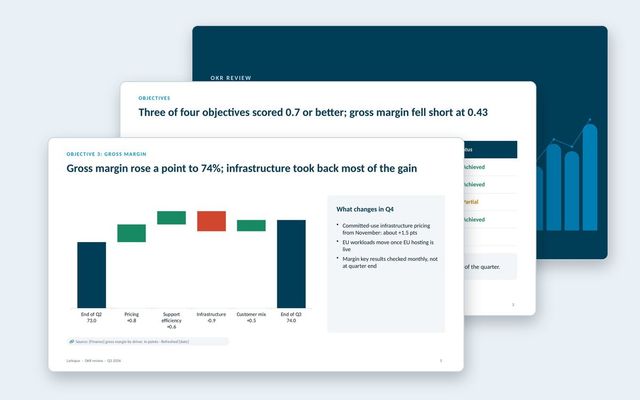 OKR reviewA quarterly OKR review: scores by objective and key result, a deep dive on the miss, lessons, draft OKRs for next quarter and decisions.See the template
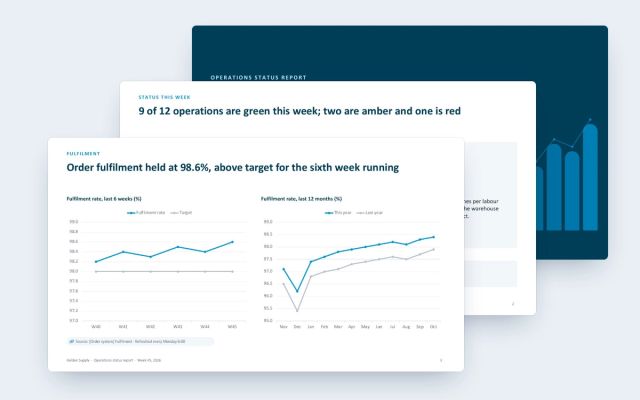 Operations status reportA weekly status report for operations: one green, amber and red grid, the red site in detail, risks and owned actions.See the template
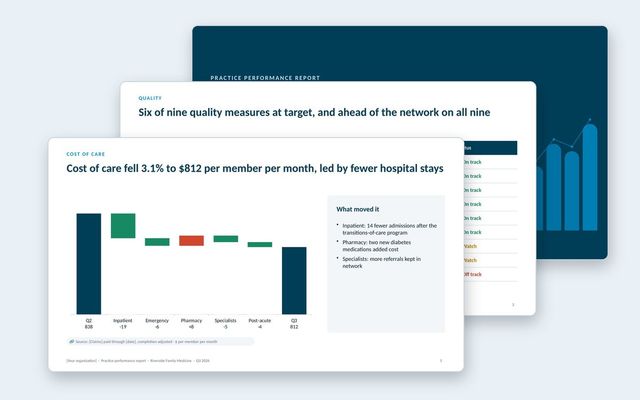 Practice performance reportOne report per practice in a value-based care network: quality measures against target and network, cost of care, hospital use, peers, engagement and savings.See the template
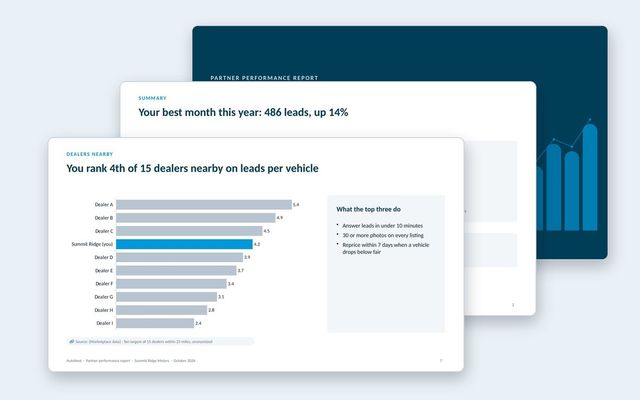 Partner performance reportOne report per partner for marketplaces: leads and funnel, inventory and pricing against the market, anonymized peers, response time and recommendations.See the template
About Rollstack.
Rollstack is the AI presentation platform for business reporting. It connects to data warehouses such as Snowflake, Databricks, BigQuery and Redshift, BI tools such as Tableau, Power BI and Looker, and spreadsheets such as Excel and Google Sheets. It also connects to CRMs such as Salesforce and HubSpot, PDFs and documents, and any other source through its API. It builds decks in your own PowerPoint or Google Slides template, links every number to its source, refreshes on a schedule, and creates one version per region, sales channel, team, product line or client. Teams build and edit decks in Rollstack, export them to PowerPoint, Google Slides or PDF, and each stakeholder gets their version in a personalized email. Rollstack is LLM-agnostic, access follows the permissions in your BI tools and warehouse, and it is SOC 2 Type II, HIPAA and GDPR compliant. Customers include SoFi, Tripadvisor, CarGurus and Octopus Energy.
Weekly business review (WBR) template: the Amazon-style deck, ready every Monday · 11 pages
Download