
Practice performance report template for value-based care networks
Free to use and adapt for your own work.
Slide 1 of 12
Rollstack team, reviewed by Nabil Jallouli Updated Nov 11, 2026
A practice performance report shows each practice in a provider network how it is doing for its attributed patients. It covers quality measures against target and the network, cost of care, hospital and emergency use, patient engagement, and what it all means for shared savings. This template gives you 9 slides for that quarterly report, built to send one version to every practice with only its own aggregate data.
The 9 slides
| # | Slide | What goes on it | Data you need |
|---|---|---|---|
| 1 | Summary | Quality measures at target, cost of care per member per month, and the main gap | Claims, EHR registry |
| 2 | Quality | Each contract measure against target and the network median | EHR quality registry, claims |
| 3 | The gap | The measure that is off track, against its path to the year-end target, with the plan | EHR |
| 4 | Cost of care | A bridge of cost per member per month from last quarter, by category | Claims |
| 5 | Hospital and emergency use | Admissions, ER visits and readmissions per 1,000 against the network | Claims |
| 6 | Peer comparison | The practice ranked on a composite quality score, and what the leader does | EHR quality registry |
| 7 | Patient engagement | Patient experience, portal activation and no-shows | Survey tool, practice management system |
| 8 | Shared savings | The current projection and what closing the gaps would add | Finance, shared savings model |
| 9 | Actions | This quarter's actions with owners and dates, and last quarter's results | Written with the practice |
| A | Appendix | Definitions of attribution, measures, cost of care and savings | Network operations |
The file has 12 pages: these 9 slides plus a cover, an appendix and a how-to slide you delete before presenting.
Rules for reports practices act on
Compare with the network, not only the target. A practice at 68% on a measure with a 75% target reads it differently when the network median is 64%. Show both.
Lead with the gap that matters most. One measure off track, with the number of patients it represents and a plan, gets more action than a page of red.
Point to a peer who solved it. The peer slide names the practice that leads on the gap and what it does differently. Practices learn faster from each other than from targets.
Show the money. Shared savings depend on quality. Showing what closing a gap is worth turns a quality conversation into a business one.
Keep patient data out of the deck. Report aggregates for the attributed population. Outreach lists go to the care team through your clinical systems, not in slides.
Mistakes we see most often
- Measure definitions that differ from the contract, so the practice and the payer disagree on the number.
- Cost figures that ignore claims not yet received, which flatters the most recent months.
- One network-wide deck that every practice has to search for its own row.
- Reports that arrive too late in the quarter to change the result.
- A team of analysts rebuilding 100 decks by hand every quarter.
One report per practice, every quarter
Most networks can only build these reports by hand for a few practices. Rollstack builds one for every practice from the same template.
- Open this template in Rollstack and connect your claims data, EHR quality registry, survey tool and savings model, directly or through your warehouse or BI tool. Rollstack also works with spreadsheets, documents and any source with an API.
- Map each chart and table to its source once.
- Create one version per practice with Bursts. Each report contains only that practice's aggregate data and its own peers.
- Schedule the reports for the same week every quarter, and refresh them before practice meetings.
- Rollstack is SOC 2 Type II and HIPAA compliant, and access follows your BI permissions. See security.
Equality Health gives each of its 800+ practices its own report with Rollstack, 2,000 decks a month.
"Rollstack made it possible to do highly personalized client reporting at scale."
Fill this template with your data Get a demo
What our customers say
“The Monthly Performance Review is now the one piece of content that reaches every practice in our network, every month, and anything we add to the master template goes out with it.”
“There is not a scenario that we could have gotten the same level of throughput, no matter how many business intelligence analysts hired because of the variability in our practice network. Rollstack made it possible to do highly personalized client reporting at scale.”
 Claire Zimmerman-NicholsChief Product and Technology Officer, Equality Health
“Rollstack has been the perfect solution for us to exponentially improve our report efficiency. As our reporting needs have grown, the need for quicker turnarounds has been critical to letting our team focus on providing actionable insights to our clients instead of being PowerPoint jockeys.”
 Scott ClairVP Decision Science and Analytics, Relevate Health
Common questions
What is a practice performance report?
A regular report, usually quarterly, that shows a medical practice how it performs for its attributed patients on quality, cost and patient experience, against targets and other practices in the network.
Which measures belong in a practice performance report?
The quality measures in your value-based contracts, such as cancer screening, diabetes control and blood pressure control, plus cost of care per member per month, hospital and emergency use, and patient experience.
How do you compare practices fairly?
Use the same measure definitions and attribution rules for every practice, report against the network median as well as the target, and use a composite score for ranking.
Can each practice see only its own data?
Yes. Each version contains only that practice's aggregate data and anonymized network benchmarks, and access follows your BI permissions.
Does the report include patient-level information?
No. The report shows aggregates for the attributed population. Patient outreach lists stay in your clinical systems.

Get the template
Free to use and adapt for your own work.
Native PowerPoint charts and tables, sample data from a fictional practice, and speaker notes on every slide. Every figure is aggregated; the template holds no patient-level data. Using Google Slides? Upload the file to Drive and open it with Google Slides; charts arrive as pictures, everything else stays editable, so it's best in PowerPoint.
Discover more templates
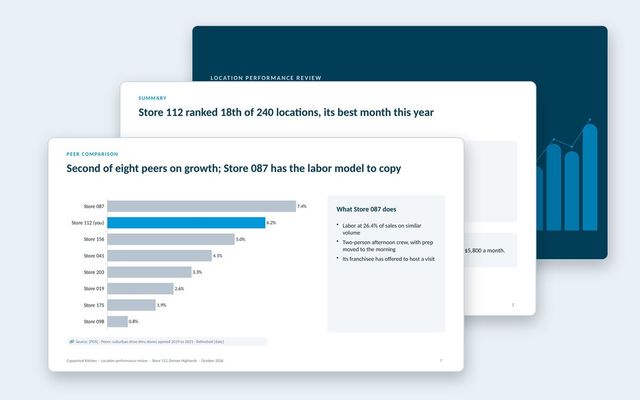 Location performance reviewOne deck per location: scorecard against target and network, sales trend, mix, labor bridge, peer comparison, guest feedback and actions.See the template
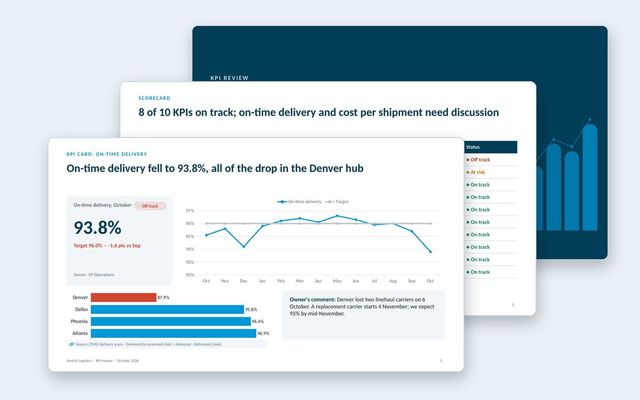 KPI presentationA KPI review built on three slide types: the scorecard, a KPI card for each KPI that needs discussion, and the exceptions list.See the template
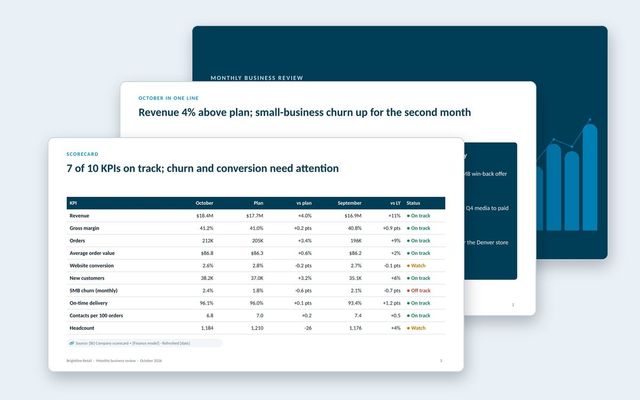 Monthly business review (MBR)A leadership MBR: the month in one line, KPI scorecard, revenue and customers, leading indicators, operations, one focus topic and decisions.See the template
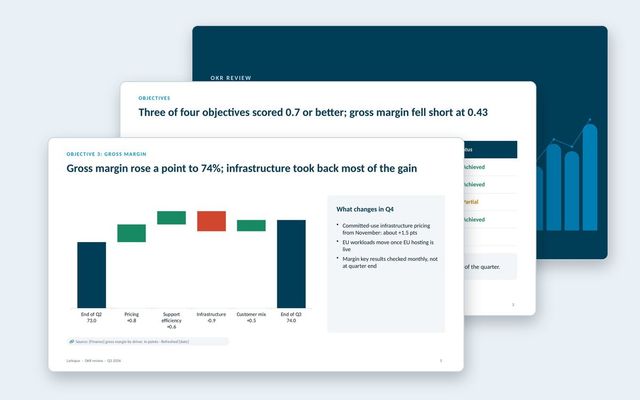 OKR reviewA quarterly OKR review: scores by objective and key result, a deep dive on the miss, lessons, draft OKRs for next quarter and decisions.See the template
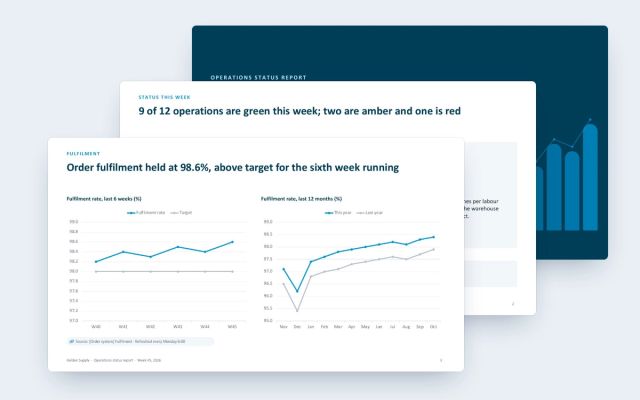 Operations status reportA weekly status report for operations: one green, amber and red grid, the red site in detail, risks and owned actions.See the template
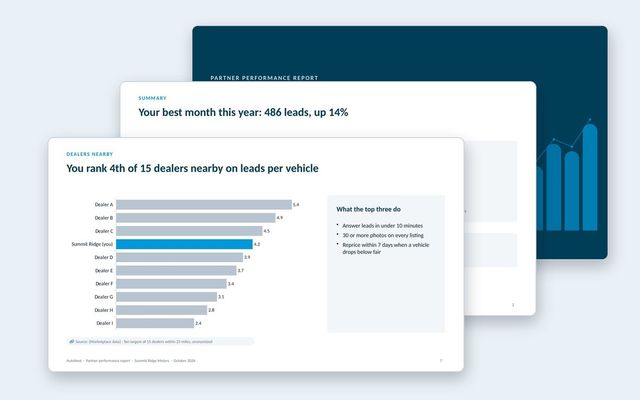 Partner performance reportOne report per partner for marketplaces: leads and funnel, inventory and pricing against the market, anonymized peers, response time and recommendations.See the template
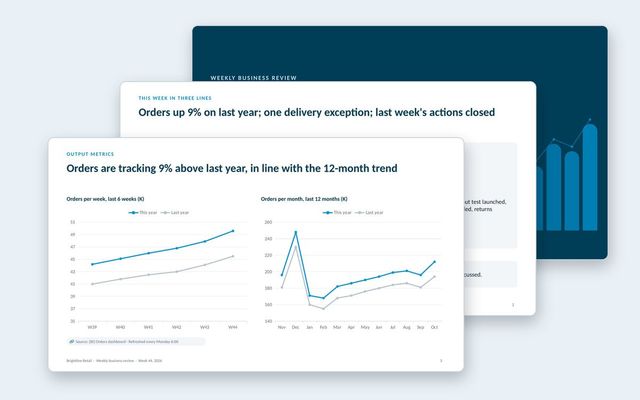 Weekly business review (WBR)A WBR in the input and output metrics style: this week in three lines, trends against last year, exceptions only, and owned actions.See the template
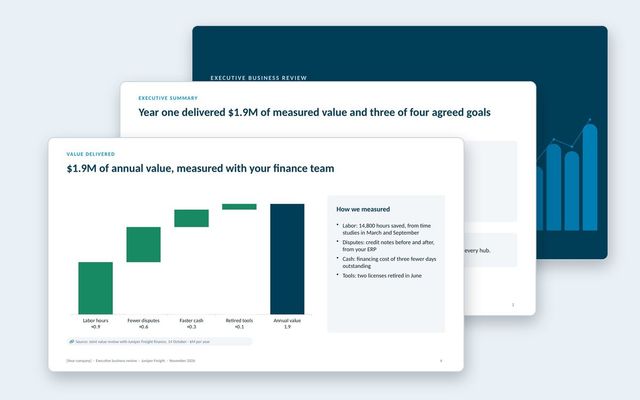 Executive business review (EBR)A renewal-stage review for the economic buyer: success plan, measured value, adoption, feedback, year-two goals and the proposal.See the template
About Rollstack.
Rollstack is the AI presentation platform for business reporting. It connects to data warehouses such as Snowflake, Databricks, BigQuery and Redshift, BI tools such as Tableau, Power BI and Looker, and spreadsheets such as Excel and Google Sheets. It also connects to CRMs such as Salesforce and HubSpot, PDFs and documents, and any other source through its API. It builds decks in your own PowerPoint or Google Slides template, links every number to its source, refreshes on a schedule, and creates one version per region, sales channel, team, product line or client. Teams build and edit decks in Rollstack, export them to PowerPoint, Google Slides or PDF, and each stakeholder gets their version in a personalized email. Rollstack is LLM-agnostic, access follows the permissions in your BI tools and warehouse, and it is SOC 2 Type II, HIPAA and GDPR compliant. Customers include SoFi, Tripadvisor, CarGurus and Octopus Energy.
Practice performance report template for value-based care networks · 12 pages
Download