
Data slide templates: 20 patterns for business reviews, with the title formula for each
Free to use and adapt for your own work.
Slide 1 of 23
Rollstack team, reviewed by Nabil Jallouli Updated Nov 11, 2026
Most business decks are built from the same 20 kinds of data slide: a summary, a scorecard, a trend, a bridge, a ranking, a benchmark, a list of decisions. This library gives you all 20 as editable PowerPoint slides with native charts, each with a note on when to use it, the title formula, the data it needs and the mistake to avoid. Pick a slide by the message you need to land, then replace the sample data.
The 20 patterns
| # | Pattern | Use it when | Title formula |
|---|---|---|---|
| 1 | Three numbers and a line | You open a review | [Metric] moved X, [metric] moved Y, and [metric] moved Z |
| 2 | Scorecard | You review the same 8 to 12 KPIs every period | N of M KPIs on track; [exceptions] need attention |
| 3 | KPI card | One KPI is off target and needs discussion | [KPI] moved to [value], [where the change came from] |
| 4 | Trend against target | Direction matters more than the latest value | [Metric] has [moved] for N periods as [cause] |
| 5 | Actual against budget | You compare a few lines with budget or plan | [Line] ran over on [cause]; [line] ran under on [cause] |
| 6 | Bridge | You explain how a total moved | [Total] moved by X; [largest driver] did most of the work |
| 7 | Cost bridge | A cost or cost ratio moved | [Cost] ran X over target, mostly [drivers] |
| 8 | Ranking | You compare teams, regions or locations on one measure | [Who] lags on [measure], because [reason] |
| 9 | Peer benchmark | The audience asks whether a number is good | [Subject] is ahead of [peers] on [measures] |
| 10 | Mix shift | The composition of a total changed | [Segment] is now X% of the total, up from Y% |
| 11 | Two views | A cut and a trend together make the point | [Overall value], but [the cut that matters] is below [threshold] |
| 12 | Explained variances | Finance needs the cause of each material variance | N variances above the threshold; M are timing |
| 13 | Exceptions only | The meeting should spend its time on the unusual | N metrics outside their expected range |
| 14 | Highlights and lowlights | You report to people who help more with bad news early | [Best news], [worst news], and [second issue] |
| 15 | Options and recommendation | You need a decision between real alternatives | [Recommended option] brings [benefit], [constraint met] |
| 16 | Roadmap | You show what happens next and the critical path | Next [period]: [milestone] in [month], [end point] in [month] |
| 17 | Decisions needed | The meeting exists to decide something | N decisions needed today, [why they matter] |
| 18 | Actions and follow-up | A recurring review agrees actions | N actions for [period]; M of last period's are done |
| 19 | Risks | Something could change the outcome, timeline or money | N risks to watch; M need [what] |
| 20 | Definitions | Any recurring deck | Definitions and data sources |
Pick the pattern from the message
Start from the sentence you want the audience to remember, then choose the slide that proves it.
| If the message is about | Use |
|---|---|
| Where we stand | Three numbers and a line, scorecard |
| Whether something is getting better | Trend against target, KPI card |
| Why a number moved | Bridge, cost bridge, explained variances |
| Who is doing well or badly | Ranking, peer benchmark |
| What changed in the composition | Mix shift |
| What needs attention | Exceptions only, risks, highlights and lowlights |
| What to do next | Options and recommendation, decisions needed, actions, roadmap |
Write action titles
Every slide in the library has an action title: a full sentence that states the takeaway. "Labor ran 1.4 points over target, mostly overtime and afternoon shifts" is an action title. "Labor" is a topic title, and it leaves the reader to work out the point. The action title tells them, and the chart proves it.
Three rules:
- One sentence, one message. If you need two sentences, you need two slides.
- Put the number in the title. "Revenue grew" is weaker than "Revenue grew 7%".
- Read the titles alone. Read only the titles of your deck, in order. If they tell the story, the deck works.
How the bridge charts are built
The bridge and cost bridge slides use a stacked column chart with an invisible base series, not PowerPoint's own waterfall chart type. That keeps them editable in older versions of PowerPoint and in Keynote. To change a bridge, right-click the chart, choose Edit Data, and update the driver values. The start and end bars are totals; every bar in between should add up to the difference.
In a cost bridge, red adds cost and green saves it. In a revenue bridge, it is the other way around. Keep the colors consistent within a deck.
Mistakes we see most often
- Choosing a chart type first and a message second.
- Topic titles such as "Revenue" or "Q3 results" that leave the takeaway to the reader.
- Pie charts for mix, where a pair of bars compares two periods far more clearly.
- Two charts on one slide making two different points.
- Status colors with no written thresholds.
Fill the slides with your own data
The patterns in this library are what Rollstack builds from your data. Describe the slide you need, or map an existing slide to a source. Rollstack fills it from your warehouse, BI tools, spreadsheets, documents or any source with an API, in your own template, with every number linked to its source.
What our customers say
“We mapped our Tableau data to slides once with Rollstack. Now every executive report updates itself. It’s the part of our data stack we didn’t know was missing.”
 Tyler DanzeyDirector, Finance Analytics, Tripadvisor
“We tried building our own solution to handle our weekly reporting, but if a visualization changed by one pixel, the whole thing broke. Rollstack replaced that fragility with enterprise-grade reliability, allowing us to generate 300+ unique slides every week.”
 Björn BolderdijkData Team Lead, Coolblue
“We had a powerful data stack, but the last mile, getting our insights into the decision-maker’s hands, was still a manual process. Rollstack gave us the critical bridge to ensure our world-class analysis and insights made it into the decks where decisions were being made.”
 Michael McElvaneySenior Director Finance Transformation, BI & Systems, SoFi
Common questions
What is a data slide?
A slide whose message rests on numbers: a chart, a table or a set of figures, with a title that states what the numbers show.
What is an action title?
A slide title written as a full sentence that states the takeaway, such as "Revenue grew 7% on two new contracts." It is standard practice in consulting and finance decks.
How many charts should a slide have?
One, in most cases. Use two only when a breakdown and a trend together make a single point, as in the two views pattern.
How do you make a waterfall chart in PowerPoint?
PowerPoint 2016 and later include a waterfall chart type under Insert, Chart. For decks that must open in older versions or Keynote, build a stacked column chart with an invisible base series, as the bridge slides in this library do.
Should I use pie charts?
Rarely. A pair of bars or a 100% stacked bar compares shares more clearly, especially across two periods.
Can I use these slides in Google Slides?
Yes. Upload the file to Drive and open it with Google Slides. Text, tables and layouts stay editable; charts come in as pictures, so edit the numbers in PowerPoint or rebuild the chart in Google Sheets.
Get the library
Free to use and adapt for your own work.
Native PowerPoint charts and tables, sample data, and guidance in the speaker notes of every slide. Using Google Slides? Upload the file to Drive and open it with Google Slides; charts arrive as pictures, everything else stays editable, so it's best in PowerPoint.
Discover more templates
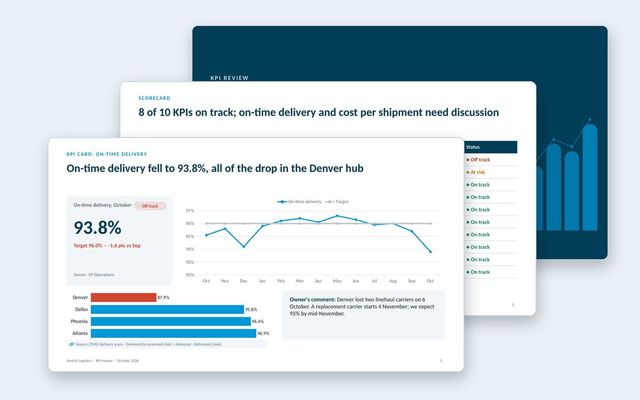 KPI presentationA KPI review built on three slide types: the scorecard, a KPI card for each KPI that needs discussion, and the exceptions list.See the template
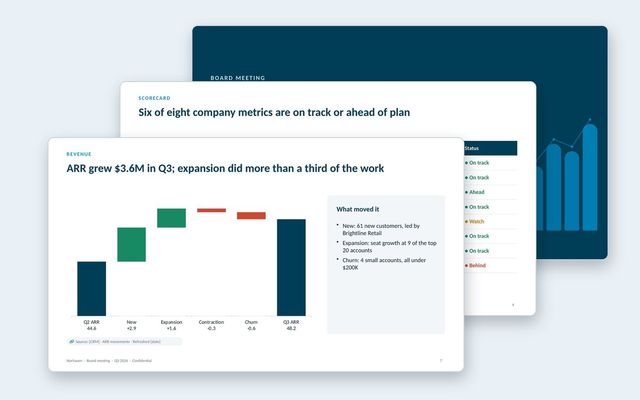 Board deckA quarterly board meeting deck: decisions first, CEO summary, scorecard, financials, customers, go-to-market, one strategic topic and the asks.See the template
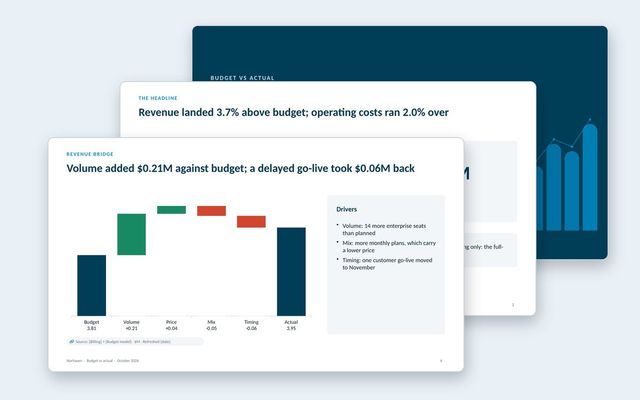 Budget vs actual reviewA monthly budget review: headline variances, summary table, revenue bridge, department spend, explained variances and the outlook.See the template
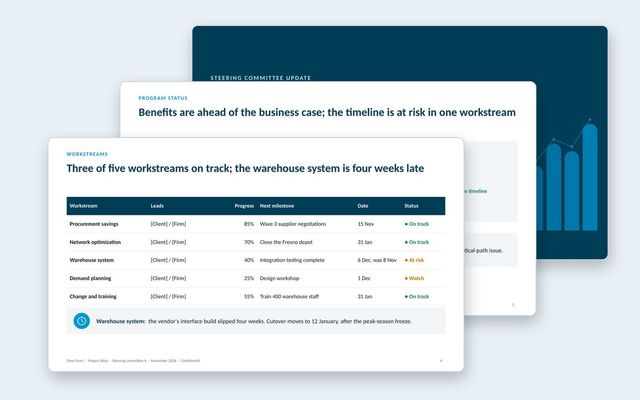 Steering committee updateA steering committee update that opens with decisions, then status, workstreams, benefits, budget, risks, plan and options.See the template
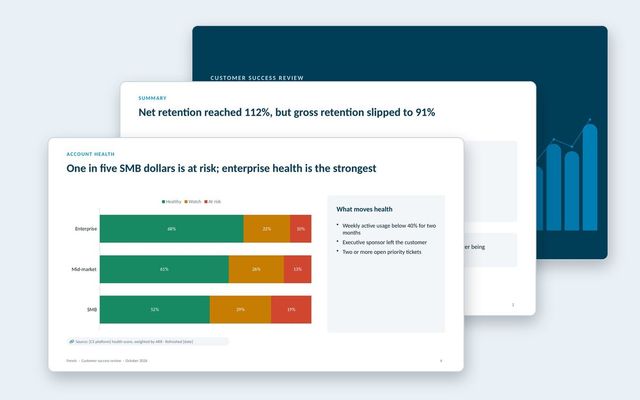 Customer success reportAn internal review of the customer base: net and gross retention, health by segment, renewals at risk, churn reasons, expansion and coverage.See the template
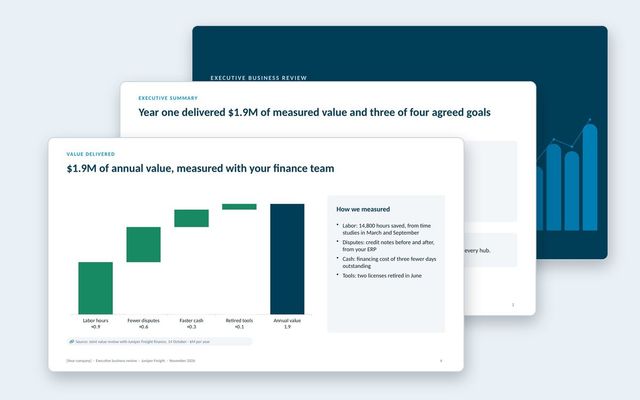 Executive business review (EBR)A renewal-stage review for the economic buyer: success plan, measured value, adoption, feedback, year-two goals and the proposal.See the template
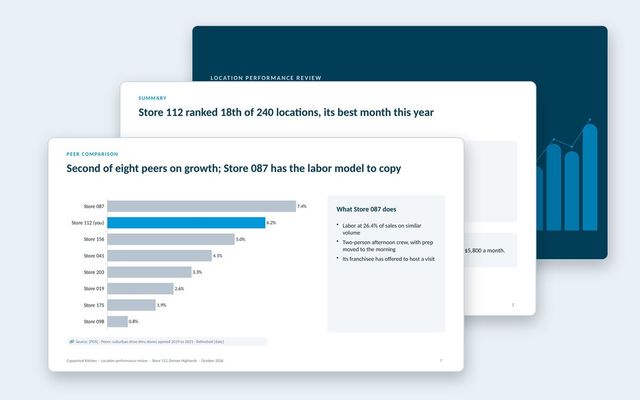 Location performance reviewOne deck per location: scorecard against target and network, sales trend, mix, labor bridge, peer comparison, guest feedback and actions.See the template
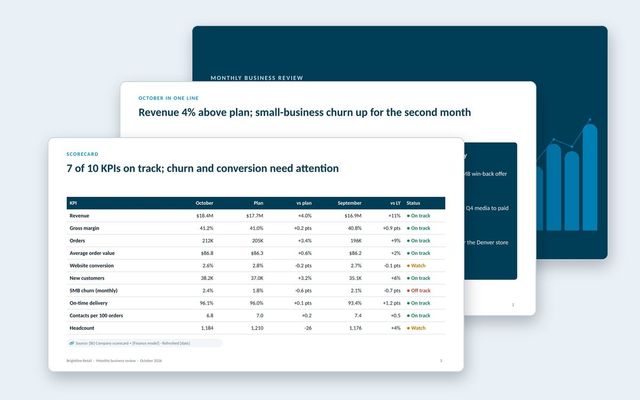 Monthly business review (MBR)A leadership MBR: the month in one line, KPI scorecard, revenue and customers, leading indicators, operations, one focus topic and decisions.See the template
About Rollstack.
Rollstack is the AI presentation platform for business reporting. It connects to data warehouses such as Snowflake, Databricks, BigQuery and Redshift, BI tools such as Tableau, Power BI and Looker, and spreadsheets such as Excel and Google Sheets. It also connects to CRMs such as Salesforce and HubSpot, PDFs and documents, and any other source through its API. It builds decks in your own PowerPoint or Google Slides template, links every number to its source, refreshes on a schedule, and creates one version per region, sales channel, team, product line or client. Teams build and edit decks in Rollstack, export them to PowerPoint, Google Slides or PDF, and each stakeholder gets their version in a personalized email. Rollstack is LLM-agnostic, access follows the permissions in your BI tools and warehouse, and it is SOC 2 Type II, HIPAA and GDPR compliant. Customers include SoFi, Tripadvisor, CarGurus and Octopus Energy.
Data slide templates: 20 patterns for business reviews, with the title formula for each · 23 pages
Download