
Budget vs actual presentation template, with the variance formulas
Free to use and adapt for your own work.
Slide 1 of 10
Rollstack team, reviewed by Nabil Jallouli Updated Nov 11, 2026
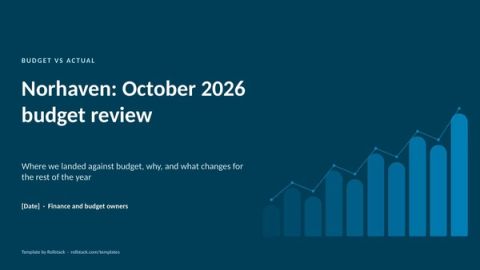
A budget vs actual review answers three questions: where did we land against plan, why, and what changes for the rest of the year. This template does that in 7 slides. Below it you'll find the variance formulas, the favorable vs unfavorable rules, and a way to send each department its own pack without building them one by one.
The 7 slides
| # | Slide | What goes on it |
|---|---|---|
| 1 | The headline | One sentence: where you landed against budget and the main reason |
| 2 | Summary table | Revenue, gross margin, operating expenses by category, EBITDA: actual, budget, variance, variance %, favorable or unfavorable |
| 3 | Revenue bridge | A waterfall from budget to actual revenue, split by driver such as volume, price and mix |
| 4 | Operating expenses | Spend by department against budget |
| 5 | Top variances explained | The five largest variances, each with the owner's explanation |
| 6 | Full-year outlook | Latest forecast against budget for the year |
| 7 | Actions and risks | What changes, who owns it, by when |
| A | Appendix | Cost-center detail and definitions |
The file has 10 pages: these 7 slides plus a cover, an appendix and a how-to slide you delete before presenting.
The formulas
Variance = Actual − Budget
Variance % = (Actual − Budget) ÷ Budget
Example: budget revenue 2,000, actual 2,150. Variance = 150. Variance % = 150 ÷ 2,000 = 7.5%.
Favorable or unfavorable
| Line | Actual above budget | Actual below budget |
|---|---|---|
| Revenue and income | Favorable | Unfavorable |
| Costs and expenses | Unfavorable | Favorable |
Three habits prevent most confusion:
- Use the absolute value of the budget in the denominator when budgets can be negative, such as a planned loss. Otherwise the sign of the percentage flips.
- Set a materiality threshold for what needs an explanation, for example a percentage and a fixed amount. Explaining every 1% wobble buries the variances that matter.
- State your sign convention. Many finance teams flip the sign on cost lines so that a positive variance always means favorable. The template does this and says so in the source line. Whichever you choose, write it on the slide.
The variance workbook has these formulas built in, flags every variance above your threshold, and ties the cost-center detail back to the summary.
Writing the explanations
"Marketing was 12% over budget" is a restatement. A useful explanation says what drove it, whether it is timing or permanent, and what happens next: "Marketing was 12% over because the Q4 campaign launched in September instead of October. Timing only; full-year spend stays on budget."
One pack per department
Most finance teams send every budget owner a version of this review for their own cost center. Built by hand, that is the same deck copied and filtered 20 or 30 times every month.
In Rollstack:
- Open this template and connect your finance model in Excel, your ERP export or your Snowflake tables.
- Map the summary table, bridge and expense slides to their sources.
- Create a Burst with one variant per department or cost center. Each owner gets only their numbers.
- After close, refresh. Rollstack can draft the variance explanations from the data, labeled for each owner to correct and approve.
What our customers say
“We mapped our Tableau data to slides once with Rollstack. Now every executive report updates itself. It’s the part of our data stack we didn’t know was missing.”
 Tyler DanzeyDirector, Finance Analytics, Tripadvisor
“We had a powerful data stack, but the last mile, getting our insights into the decision-maker’s hands, was still a manual process. Rollstack gave us the critical bridge to ensure our world-class analysis and insights made it into the decks where decisions were being made.”
 Michael McElvaneySenior Director Finance Transformation, BI & Systems, SoFi
“The quarter ended, roughly 80 slides on the board deck, and I just clicked run—all updated. That used to take full days of copying and pasting.”
 Matt CoxDirector of Strategy & Operations, Cribl
Common questions
How do you calculate budget vs actual variance?
Variance equals actual minus budget. Variance percentage equals that variance divided by the budget.
Is a positive variance good?
For revenue, yes. For costs, a positive variance means you spent more than planned, which is unfavorable.
How often should you present budget vs actual?
Monthly for management, quarterly for the board, with the same structure each time.
What chart works best for budget vs actual?
A waterfall from budget to actual shows which drivers moved the result. A bar chart of actual against budget by department shows where spend landed.
Get the template
Free to use and adapt for your own work.
Native PowerPoint charts and tables, sample data from a fictional company, and speaker notes on every slide. Using Google Slides? Upload the file to Drive and open it with Google Slides; charts arrive as pictures, everything else stays editable, so it's best in PowerPoint.
Discover more templates
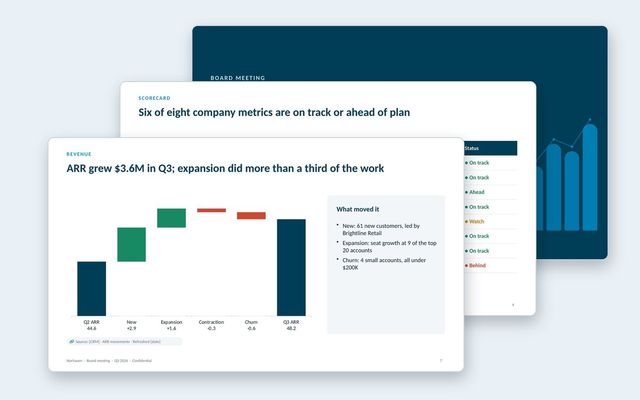 Board deckA quarterly board meeting deck: decisions first, CEO summary, scorecard, financials, customers, go-to-market, one strategic topic and the asks.See the template
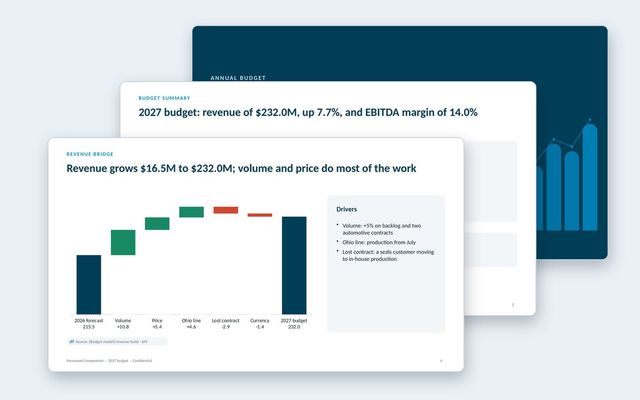 Annual budget presentationThe annual budget for approval: assumptions, revenue bridge, product lines, costs, headcount, capex, scenarios, sensitivities and approvals.See the template
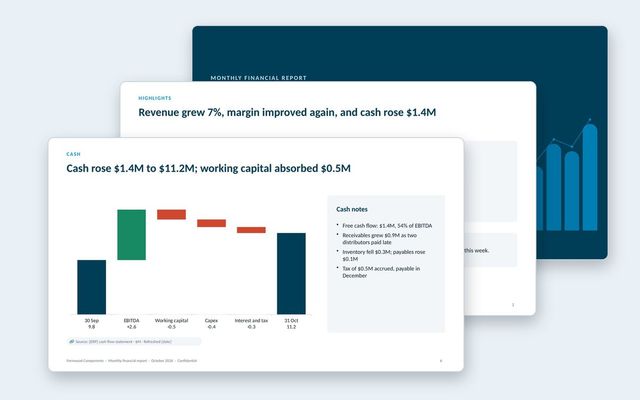 Monthly financial reportThe month-end pack for leadership: profit and loss, revenue and margins, cash bridge, working capital, balance sheet and full-year outlook.See the template
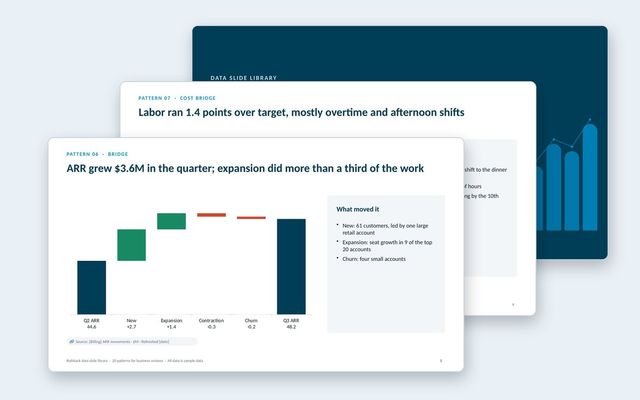 Data slide libraryTwenty reusable data slides: summaries, scorecards, KPI cards, trends, bridges, rankings, benchmarks, variances, options, roadmaps, decisions and risks.See the template
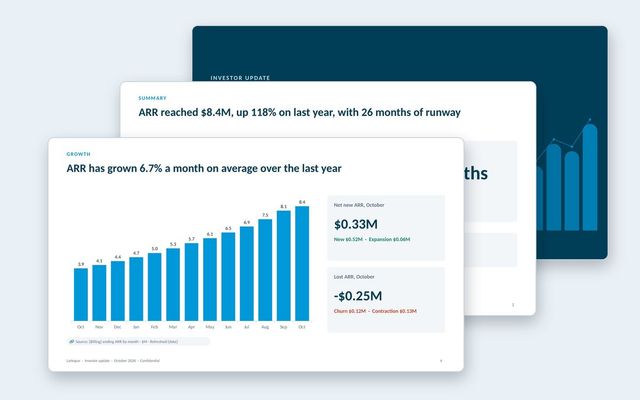 Investor updateA monthly investor update with growth, retention, burn and runway, highlights and lowlights, milestones and specific asks.See the template
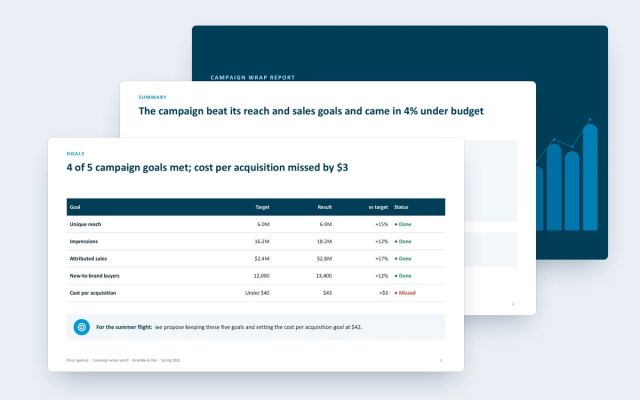 Campaign wrap reportA client-facing wrap report for agencies: goals against results, channel delivery and efficiency, creative, audience, brand lift and next moves.See the template
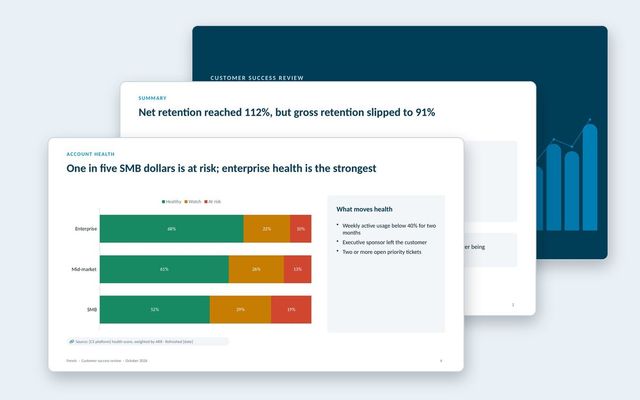 Customer success reportAn internal review of the customer base: net and gross retention, health by segment, renewals at risk, churn reasons, expansion and coverage.See the template
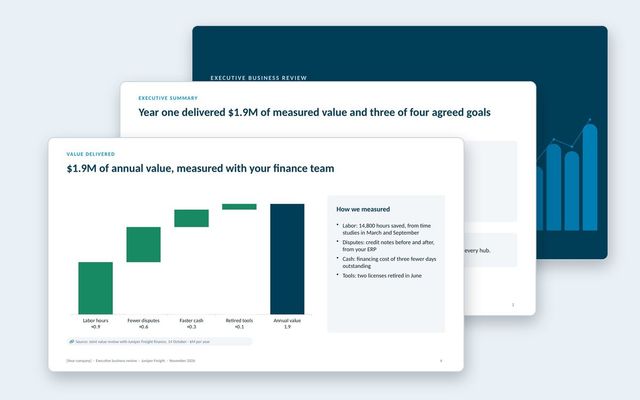 Executive business review (EBR)A renewal-stage review for the economic buyer: success plan, measured value, adoption, feedback, year-two goals and the proposal.See the template
About Rollstack.
Rollstack is the AI presentation platform for business reporting. It connects to data warehouses such as Snowflake, Databricks, BigQuery and Redshift, BI tools such as Tableau, Power BI and Looker, and spreadsheets such as Excel and Google Sheets. It also connects to CRMs such as Salesforce and HubSpot, PDFs and documents, and any other source through its API. It builds decks in your own PowerPoint or Google Slides template, links every number to its source, refreshes on a schedule, and creates one version per region, sales channel, team, product line or client. Teams build and edit decks in Rollstack, export them to PowerPoint, Google Slides or PDF, and each stakeholder gets their version in a personalized email. Rollstack is LLM-agnostic, access follows the permissions in your BI tools and warehouse, and it is SOC 2 Type II, HIPAA and GDPR compliant. Customers include SoFi, Tripadvisor, CarGurus and Octopus Energy.
Budget vs actual presentation template, with the variance formulas · 10 pages
Download