
Monthly financial report template: the month-end pack for your leadership team
Free to use and adapt for your own work.
Slide 1 of 12
Rollstack team, reviewed by Nabil Jallouli Updated Nov 11, 2026
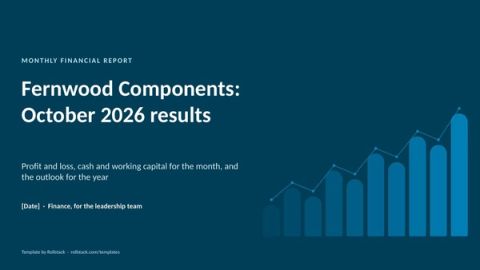
A monthly financial report tells the leadership team how the month went, where the cash went, and whether the year is still on track. This monthly financial report template does it in 9 slides: highlights, profit and loss, revenue, margins, a cash bridge, working capital, the balance sheet, the full-year outlook and the operating metrics behind the numbers. Every number in the sample reconciles, so you can see how the pieces fit.
The 9 slides
| # | Slide | What goes on it | Data you need |
|---|---|---|---|
| 1 | Highlights | Revenue, EBITDA and cash, each with its comparison, and one watch item | General ledger, bank |
| 2 | Profit and loss | Summary P&L against budget and last year, with margins | General ledger, budget model |
| 3 | Revenue | Revenue by product line or segment against last year, with the drivers | ERP or billing |
| 4 | Margins | Thirteen months of gross and EBITDA margin, and what moved them | General ledger |
| 5 | Cash | A bridge from opening to closing cash: EBITDA, working capital, capex, interest and tax | Cash flow statement |
| 6 | Working capital | Days sales outstanding, days inventory, days payables and receivables by age | ERP subledgers |
| 7 | Balance sheet | Condensed balance sheet against last month, net debt and covenant headroom | General ledger |
| 8 | Full-year outlook | Latest forecast against budget, with upside and risks | Forecast model |
| 9 | Operating metrics | Four operating numbers that explain the financial ones, such as backlog | ERP, HR system |
| A | Appendix | Definitions of EBITDA, free cash flow, the days measures and net debt | Finance |
The file has 12 pages: these 9 slides plus a cover, an appendix and a how-to slide you delete before presenting.
Which finance deck do you need?
| Deck | Audience | Cadence | Question it answers |
|---|---|---|---|
| Monthly financial report | Leadership team | Monthly | How did the month go, where did the cash go, is the year on track? |
| Budget vs actual review | Budget owners | Monthly | Which lines ran over or under, and why? |
| Board deck | Board of directors | Quarterly | What do directors need to decide? |
| Investor update | Investors | Monthly or quarterly | How is the company growing, and how can investors help? |
Rules for a pack people trust
Make it reconcile. The cash bridge should tie to the cash flow statement, the change in equity to net income, and revenue to the same figure on every slide. Readers who find one mismatch stop trusting the rest.
Explain, don't restate. "Revenue rose 7%" is already in the table. The commentary should say why: two new contracts, a price increase, a timing shift.
Keep the order fixed. The same slides in the same order every month, so the leadership team knows where to look and notices what changed.
Agree a materiality threshold. Explain movements above it and leave the rest to the appendix.
Ship it fast. A pack that lands three weeks after month end describes history. Aim for the first week after close.
Mistakes we see most often
- Numbers retyped from the ledger into slides, with rounding that differs between slides.
- A cash slide that shows the balance but not what moved it.
- Working capital reported as a balance instead of in days, which hides the trend.
- Forecast changes with no explanation of what changed since last month.
- The pack rebuilt from scratch every month by the same analyst.
Refresh it after close
After close, most of this pack is the same structure with new numbers. Rollstack fills it from your systems so the finance team spends its time on the commentary.
- Open this template in Rollstack, or your existing pack, and connect your ERP or general ledger, your budget and forecast models in Excel or Google Sheets, and your BI dashboards. Rollstack also works with warehouses, documents and any source with an API.
- Map each table and chart to its source once.
- After close, refresh. Every figure shows its source and the time it was synced, so the review focuses on what changed.
- Rollstack can draft variance commentary for the team to edit, labeled as AI-drafted.
- Rollstack keeps every version, so you can see exactly what leadership saw each month.
SoFi updates more than 400 slides and 30+ decks every month with Rollstack.
Fill this template with your data Get a demo
What our customers say
“We mapped our Tableau data to slides once with Rollstack. Now every executive report updates itself. It’s the part of our data stack we didn’t know was missing.”
 Tyler DanzeyDirector, Finance Analytics, Tripadvisor
“We had a powerful data stack, but the last mile, getting our insights into the decision-maker’s hands, was still a manual process. Rollstack gave us the critical bridge to ensure our world-class analysis and insights made it into the decks where decisions were being made.”
 Michael McElvaneySenior Director Finance Transformation, BI & Systems, SoFi
“By minimizing the manual overhead involved in data preparation, our team now has much more time to focus on the data interrogation step and creating well-informed proposals, which leads to better outcomes for our customers and our business.”
 Ivan LourieHead of Credit Risk, Octopus Energy
Common questions
What is a monthly financial report?
A pack the finance team prepares after each month-end close that shows the leadership team the month's results, cash position, balance sheet and outlook, with commentary on what drove them.
What should a monthly financial report include?
Highlights, a summary profit and loss against budget and last year, revenue and margin trends, a cash bridge, working capital, a condensed balance sheet, the full-year outlook and the key operating metrics.
What is the difference between management accounts and financial statements?
Financial statements follow accounting standards and are prepared for external users. Management accounts, including a monthly financial report, are prepared for internal decisions and add budgets, forecasts, operating metrics and commentary.
How soon after month end should the report go out?
Within five to ten working days of month end for most companies. The faster close and reporting run, the more useful the pack is.
Should the report be in Excel or PowerPoint?
Keep the model in Excel and present in PowerPoint. Leaders read slides with commentary; analysts check the workbook. Linking the two avoids retyping numbers.
Who should receive the monthly financial report?
The CEO and leadership team, and budget owners for their own lines. Boards usually get a quarterly version.
Get the template
Free to use and adapt for your own work.
Native PowerPoint charts and tables, sample data from a fictional company, and speaker notes on every slide. Using Google Slides? Upload the file to Drive and open it with Google Slides; charts arrive as pictures, everything else stays editable, so it's best in PowerPoint.
Discover more templates
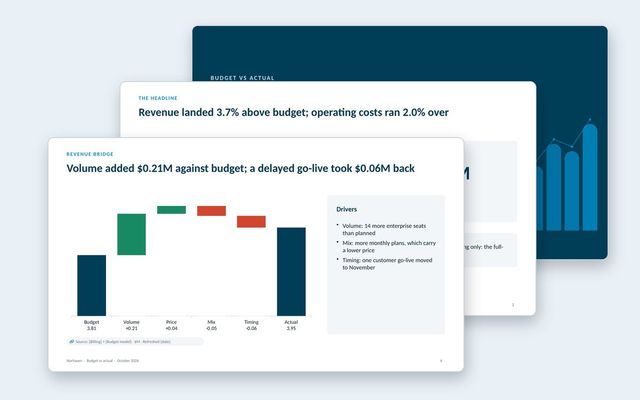 Budget vs actual reviewA monthly budget review: headline variances, summary table, revenue bridge, department spend, explained variances and the outlook.See the template
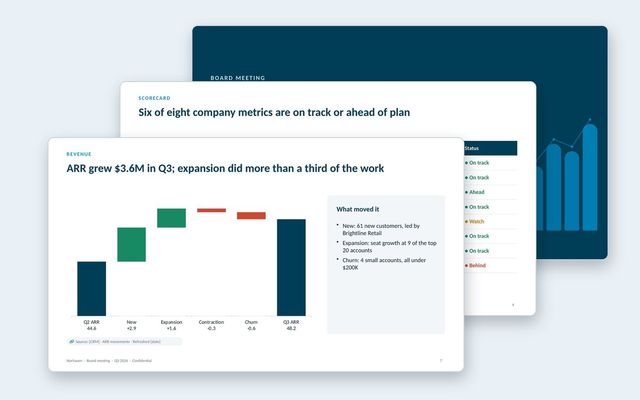 Board deckA quarterly board meeting deck: decisions first, CEO summary, scorecard, financials, customers, go-to-market, one strategic topic and the asks.See the template
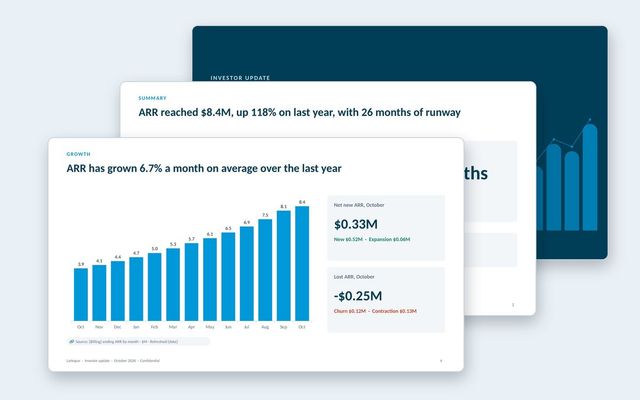 Investor updateA monthly investor update with growth, retention, burn and runway, highlights and lowlights, milestones and specific asks.See the template
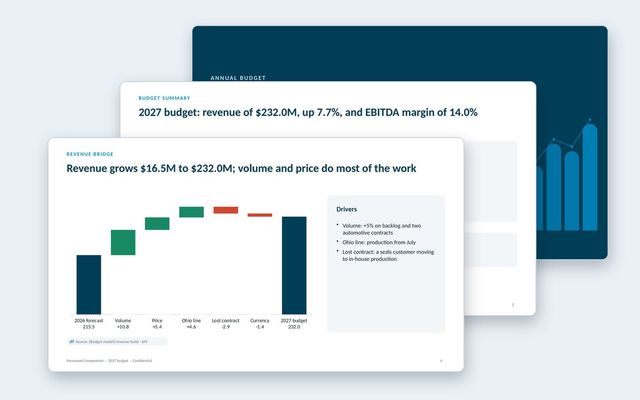 Annual budget presentationThe annual budget for approval: assumptions, revenue bridge, product lines, costs, headcount, capex, scenarios, sensitivities and approvals.See the template
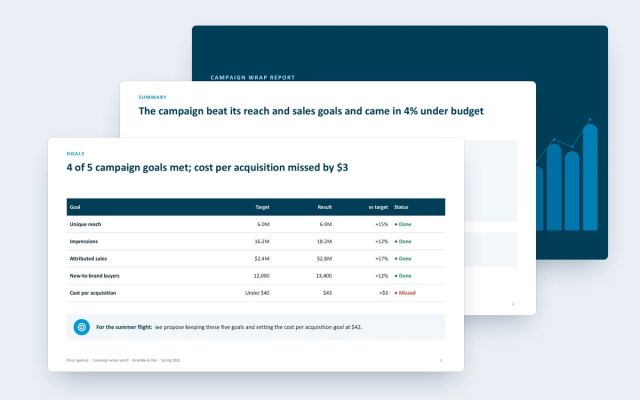 Campaign wrap reportA client-facing wrap report for agencies: goals against results, channel delivery and efficiency, creative, audience, brand lift and next moves.See the template
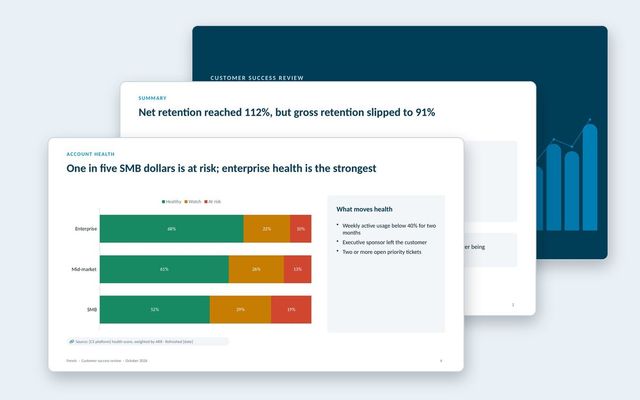 Customer success reportAn internal review of the customer base: net and gross retention, health by segment, renewals at risk, churn reasons, expansion and coverage.See the template
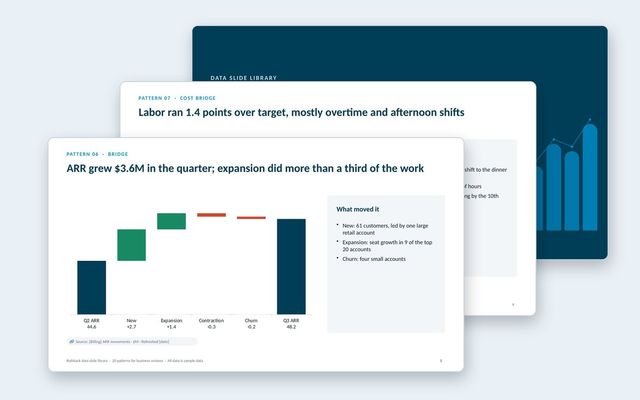 Data slide libraryTwenty reusable data slides: summaries, scorecards, KPI cards, trends, bridges, rankings, benchmarks, variances, options, roadmaps, decisions and risks.See the template
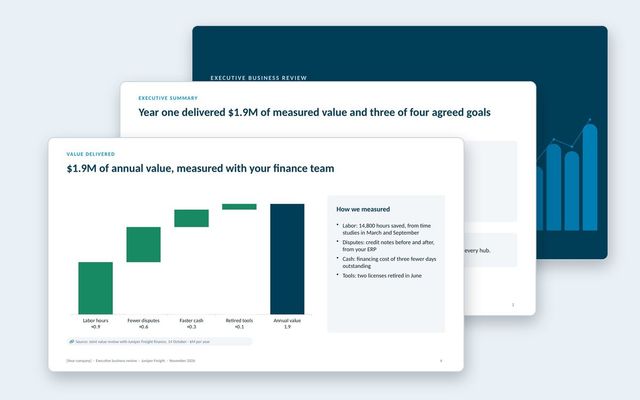 Executive business review (EBR)A renewal-stage review for the economic buyer: success plan, measured value, adoption, feedback, year-two goals and the proposal.See the template
About Rollstack.
Rollstack is the AI presentation platform for business reporting. It connects to data warehouses such as Snowflake, Databricks, BigQuery and Redshift, BI tools such as Tableau, Power BI and Looker, and spreadsheets such as Excel and Google Sheets. It also connects to CRMs such as Salesforce and HubSpot, PDFs and documents, and any other source through its API. It builds decks in your own PowerPoint or Google Slides template, links every number to its source, refreshes on a schedule, and creates one version per region, sales channel, team, product line or client. Teams build and edit decks in Rollstack, export them to PowerPoint, Google Slides or PDF, and each stakeholder gets their version in a personalized email. Rollstack is LLM-agnostic, access follows the permissions in your BI tools and warehouse, and it is SOC 2 Type II, HIPAA and GDPR compliant. Customers include SoFi, Tripadvisor, CarGurus and Octopus Energy.
Monthly financial report template: the month-end pack for your leadership team · 12 pages
Download