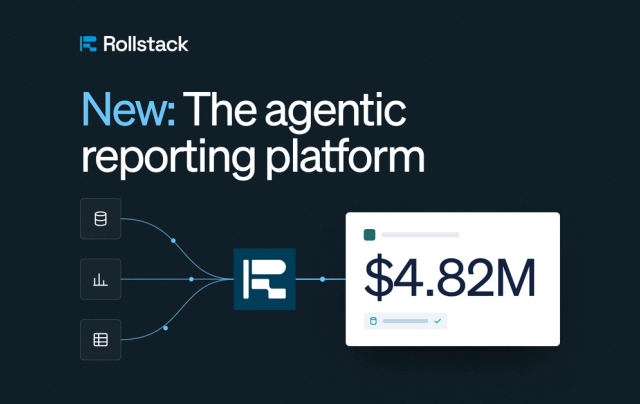
Most reporting data lives in a warehouse. Most reporting gets read on a slide. Getting from one to the other has usually meant building a dashboard in between, even when the only reader of that dashboard was the deck.
Today, Rollstack reads straight from your data warehouse. A SQL query on Snowflake, Databricks or BigQuery becomes a chart, a table or a score card on your slide, and it runs again at every update. Write the query yourself, paste one you already have, or describe what you need in plain words and Rollstack Agent writes it.
Rollstack is the AI presentation platform for business reporting. It builds slide decks from your company's data, in your own template, and keeps them current.
The warehouse now serves both sides of a reporting team: the data team that owns the SQL, and the finance, customer success and operations teams that own the deck.
The data warehouse integration
The data warehouse integration lets a Rollstack report read Snowflake, Databricks and BigQuery directly. A SQL query becomes a datasheet, and the datasheet becomes a chart, a table or a score card on a slide. The query runs again at every update.
In practice, that's four things:
- Warehouse to slide, with no dashboard in between. Write SQL in an editor that browses your tables, suggests names as you type and previews the rows first.
- SQL from a request in plain words. Describe the data you need and Rollstack Agent writes the SQL for Snowflake, Databricks or BigQuery, or changes the query already in the editor.
- An agent that works from your tables. Connect tables as context and Rollstack Agent writes and runs its own queries to build slides. Each one is saved as a datasheet you can check.
- One query for every region, team or client. Variables and column filters link to report parameters and bursts, so nobody edits the SQL for each version.
How it works: monthly revenue from Snowflake
Here's the path from a Snowflake table to a slide, for one common ask: monthly revenue for one region over the last 12 months.
1. Connect the warehouse. Add Snowflake from Connections. Each person signs in with their own warehouse account, or an admin sets up one service account for everyone.
2. Open Add data and choose Query. The editor browses your tables and suggests names as you type.
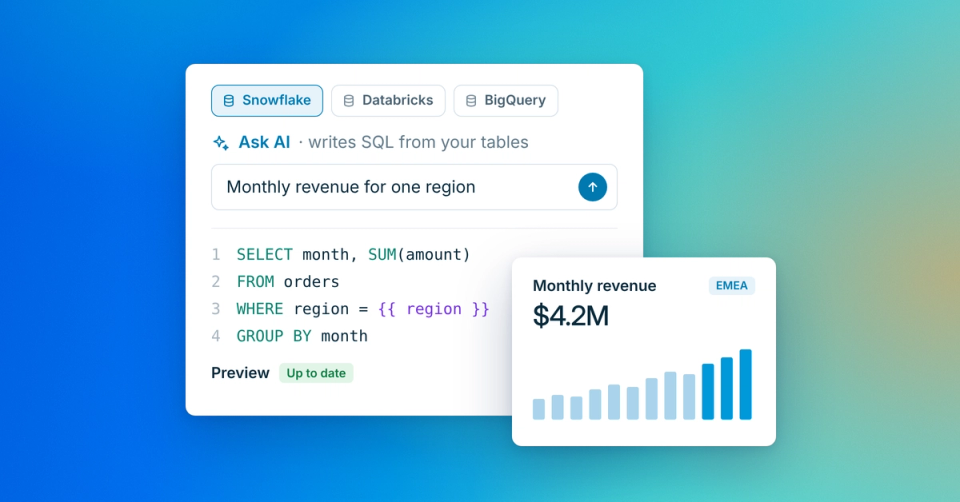
3. Write the query, or ask for it. Type the SQL yourself. Or put the request in the Ask AI box, "Monthly revenue for one region over the last 12 months", and Rollstack Agent writes the Snowflake SQL:
SELECT
  DATE_TRUNC('month', o.ORDER_DATE) AS MONTH,
  SUM(o.AMOUNT) AS REVENUE
FROM ORDERS o
JOIN ACCOUNTS a ON o.ACCOUNT_ID = a.ACCOUNT_ID
JOIN REGIONS r ON a.REGION_ID = r.REGION_ID
WHERE r.REGION_NAME = {{ region }}
  AND o.ORDER_DATE >= DATEADD(month, -12, CURRENT_DATE)
GROUP BY MONTH
ORDER BY MONTH
4. Preview the rows. Run the query. The preview shows the rows before anything reaches a slide.
5. Put it on the slide. Choose how the result lands: as a chart, a table or a score card.
6. Let it run. The query runs again at every update, so next month's deck shows next month's numbers with no new export and no rebuilt chart.
The {{ region }} on line 7 is a variable. It's what lets this one query serve every region, as covered below.
Do you need to know SQL?
No. There are three ways to get a query onto a slide, and a business team can use any of them:
- Write it. For analysts and anyone at home in SQL, the editor browses tables, suggests names as you type and previews the rows.
- Paste it. Take a query your data team already wrote and vetted, run the preview and build the slide from it.
- Ask for it. Describe the data in plain words, such as revenue by region for the last 12 months. Rollstack Agent writes the SQL for Snowflake, Databricks or BigQuery, or changes the query already in the editor.
The Agent works from the tables your query reads and the ones you add, and it asks before it drops one of your variables. Whichever way the query arrives, the preview shows the rows before anything reaches a slide.
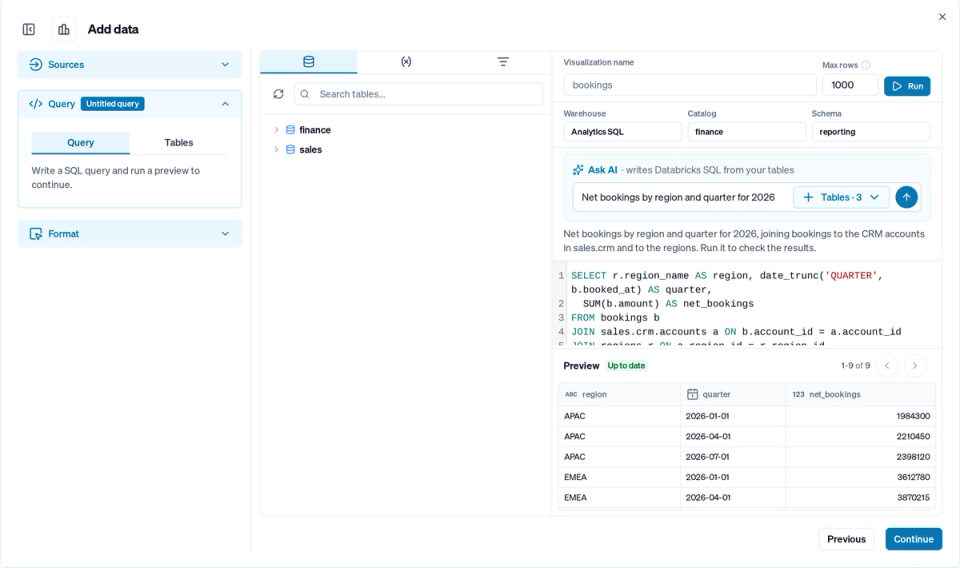
Requests can be as plain as the question you'd send your analyst:
- "Revenue by region for the last 12 months." For finance and FP&A teams building the monthly review.
- "Net bookings by region and quarter for 2026." For RevOps and sales ops teams ahead of the business review.
- "Open tickets and renewal date for each account." For customer success teams preparing QBRs.
- "Spend and conversions by campaign for last month." For marketing teams and agencies reporting to clients.
The result is the same in every case: a saved query that anyone on the team can open, read and correct.
Good SQL still depends on agreed definitions. Most data teams keep those in a semantic layer, so a metric like revenue means the same thing in every query, whoever writes it.
Rollstack connects to it, whether that is a dbt semantic layer, a Snowflake semantic view or Databricks metric views. The Agent then writes its queries with those definitions.
How does one query serve every region, team or client?
With variables and filters. A variable such as {{ region }} puts a filter inside the SQL, and column filters narrow the results. Nobody edits the query to change the audience.
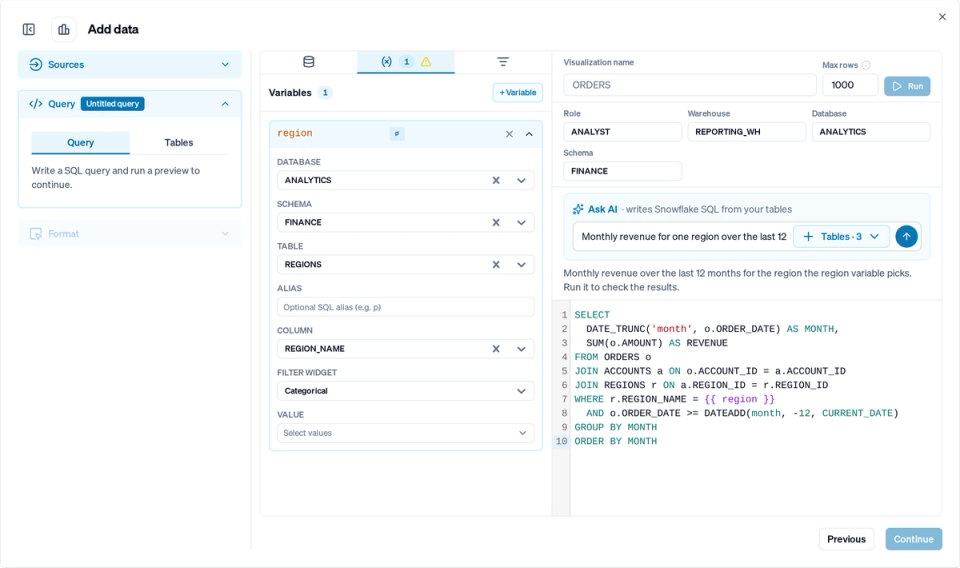
Report parameters and bursts link to them like any other source's filters. So the query above doesn't need a copy per region. One version of the SQL serves every region, team or client, and a burst turns one report into one version for each.
When the logic itself has to change, Edit in SQL opens the query from the slide. Change it once and every datasheet reading it redraws.
Who sees what?
Access follows the warehouse. There are two ways to set it up:
- Each person's own account. Everyone signs in with their own warehouse account and sees only what their roles and grants allow. The rules your data team already set in the warehouse apply to the deck.
- One service account. An admin sets up a single service account for everyone. That suits teams where most report builders don't have a warehouse login.
Snowflake connects with OAuth or a key pair, Databricks with OAuth or a service principal, and BigQuery with OAuth or a service account key.
Rollstack is SOC 2 Type II, HIPAA and GDPR compliant. See security at Rollstack.
Do you still need a dashboard?
Often, yes. Dashboards are still the right home for exploration and for metrics your BI tool already governs. Rollstack keeps connecting to Tableau, Power BI, Looker and the other BI tools you use.
Keep your semantic layer too. If your metrics are defined once, in dbt or in the warehouse itself, that definition stays the source of truth, and the queries behind your slides should follow it.
What you can drop is the dashboard that exists only to feed a slide.
| Read from the BI tool | Read from the warehouse | |
|---|---|---|
| Use it when | The metric already lives in a dashboard your team trusts | The chart exists only for the deck, or the data never reached a dashboard |
| What you maintain | The dashboard and the slide | One query and the slide |
| How it fits each audience | The dashboard's filters | Variables and column filters in the query |
Either way, report parameters and bursts link to the source's filters in the same way.
How do you connect it?
Set one up from Connections:
- Add Snowflake, Databricks or BigQuery as a connection.
- In a report, open Add data and choose the warehouse as the source.
- Write a query or ask Rollstack Agent for one, preview the rows and place the result on a slide.
The Snowflake guide and the Databricks guide cover each step. No Rollstack account yet? Get a demo.
The bottom line
The shortest path from a warehouse to a slide is now one query. Your data team keeps control of the SQL and of who sees what. Your business teams get the chart without waiting for a dashboard, whether they write the query, paste it or ask for it. And the deck stays current, because the same query runs at every update.
Rollstack is the AI presentation platform for business reporting, and it now reads straight from the warehouse your team already trusts.