

Today we're launching the new Rollstack, the biggest release in our company's history. We rebuilt it so data and business teams can go from data to polished, executive-level presentations in seconds.
The new Rollstack is the agentic reporting platform: one place to analyze, present and scale every report from your trusted data. At its core is the first agentic slides platform built for business reporting, with deep workflows connected to your data stack, from data warehouses and BI tools to semantic layers and spreadsheets. It's the harness reporting never had.
Why we rebuilt Rollstack
The deck is the data stack's blind spot
I've spent most of my career leading data and analytics teams, or working right next to them, at Groupon, Pinterest and Deel. I've also built a lot of decks in investment banking and as a strategy consultant at BCG. In every one of those roles, the deck was how we informed leadership and supported decisions. It still is, everywhere: the board deck, the monthly business review, the QBR a customer gets, the pack that goes to each franchisee or regional manager. That's where leadership lives, and where decisions get made.
The teams building those decks always wanted 3 things. First, to pull an analysis quickly, with correct numbers. Second, to have every analysis repeatable by default. Third, to present it to their audience like the best strategy consultants would.
But building those decks has always been one-off, manual and disconnected from the data stack. A modern data stack can trace a number from the source system all the way to the dashboard. Then it stops: the deck is its blind spot. So data and BI teams turned to dashboards to share insights instead.
Dashboards rarely reached decision-makers and leadership
The problem is that dashboards never took off beyond the people who work in the data. In BARC's 2022 study, only about 25% of employees actively used BI tools. Everyone else still gets their numbers in a deck, copied, screenshotted and re-typed, with no way to trace where they came from. This limited data teams' ability to influence leadership, and business teams found themselves exporting data manually from the data stack to build decks manually.
So every reporting cycle looks the same. Analysts pull numbers from the warehouse, a couple of dashboards and the finance team's spreadsheet, and reconcile them by hand. The template changed since last week, so the deck gets rebuilt. Someone pulls an all-nighter before the review, and the CFO ends up being the last check, the one who finds that slide 14 doesn't match slide 3. CFOs and customers can't afford a wrong number, so every number gets checked by hand, every cycle.
AI was supposed to fix this. It can build a deck from a prompt in a minute, and it looks great. But it doesn't know your business context, it struggles to stay on brand, it can't tell you where a number came from, and it comes out a little different every time you run it. When the CFO, the board or a customer asks how you got a number, you have to be able to explain it, and "ChatGPT gave it to me" isn't an answer. Verifying an AI-generated deck often means redoing all the work yourself. So the reconciling, the checking and the all-nighters are still there. AI can generate a slide. The hard part is delivering numbers you can trust, reliably, in your brand, tailored to every stakeholder, every cycle.
Reporting never got a harness
Other functions got purpose-built tools. Engineers have Cursor while lawyers have Harvey and Legora. Each one is a harness: the model, plus everything around it that makes its work safe to use, like the context it reads, the checks on its output and the review before anything goes out.
Business reporting never got one. So we rebuilt it.
We built the harness for reporting
Here's what it looks like.
Agentic slides
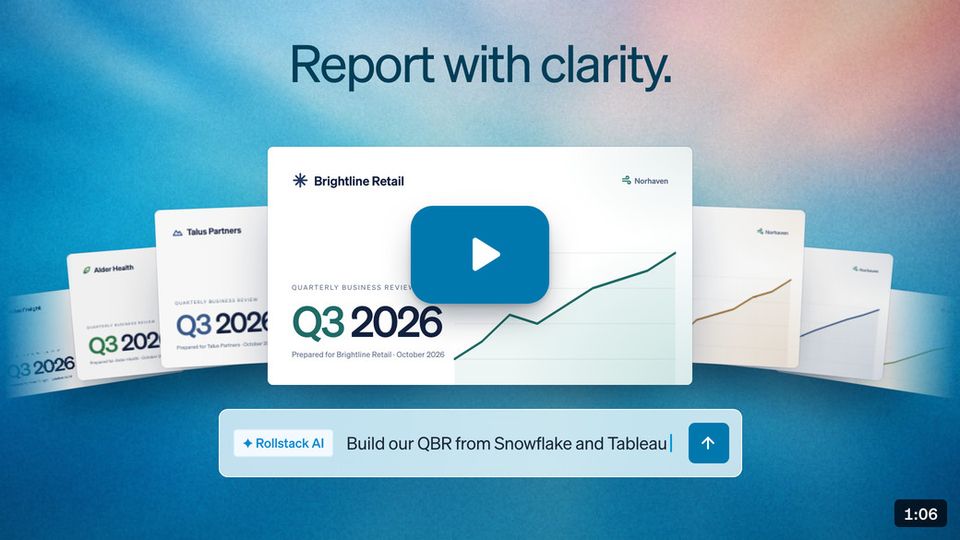
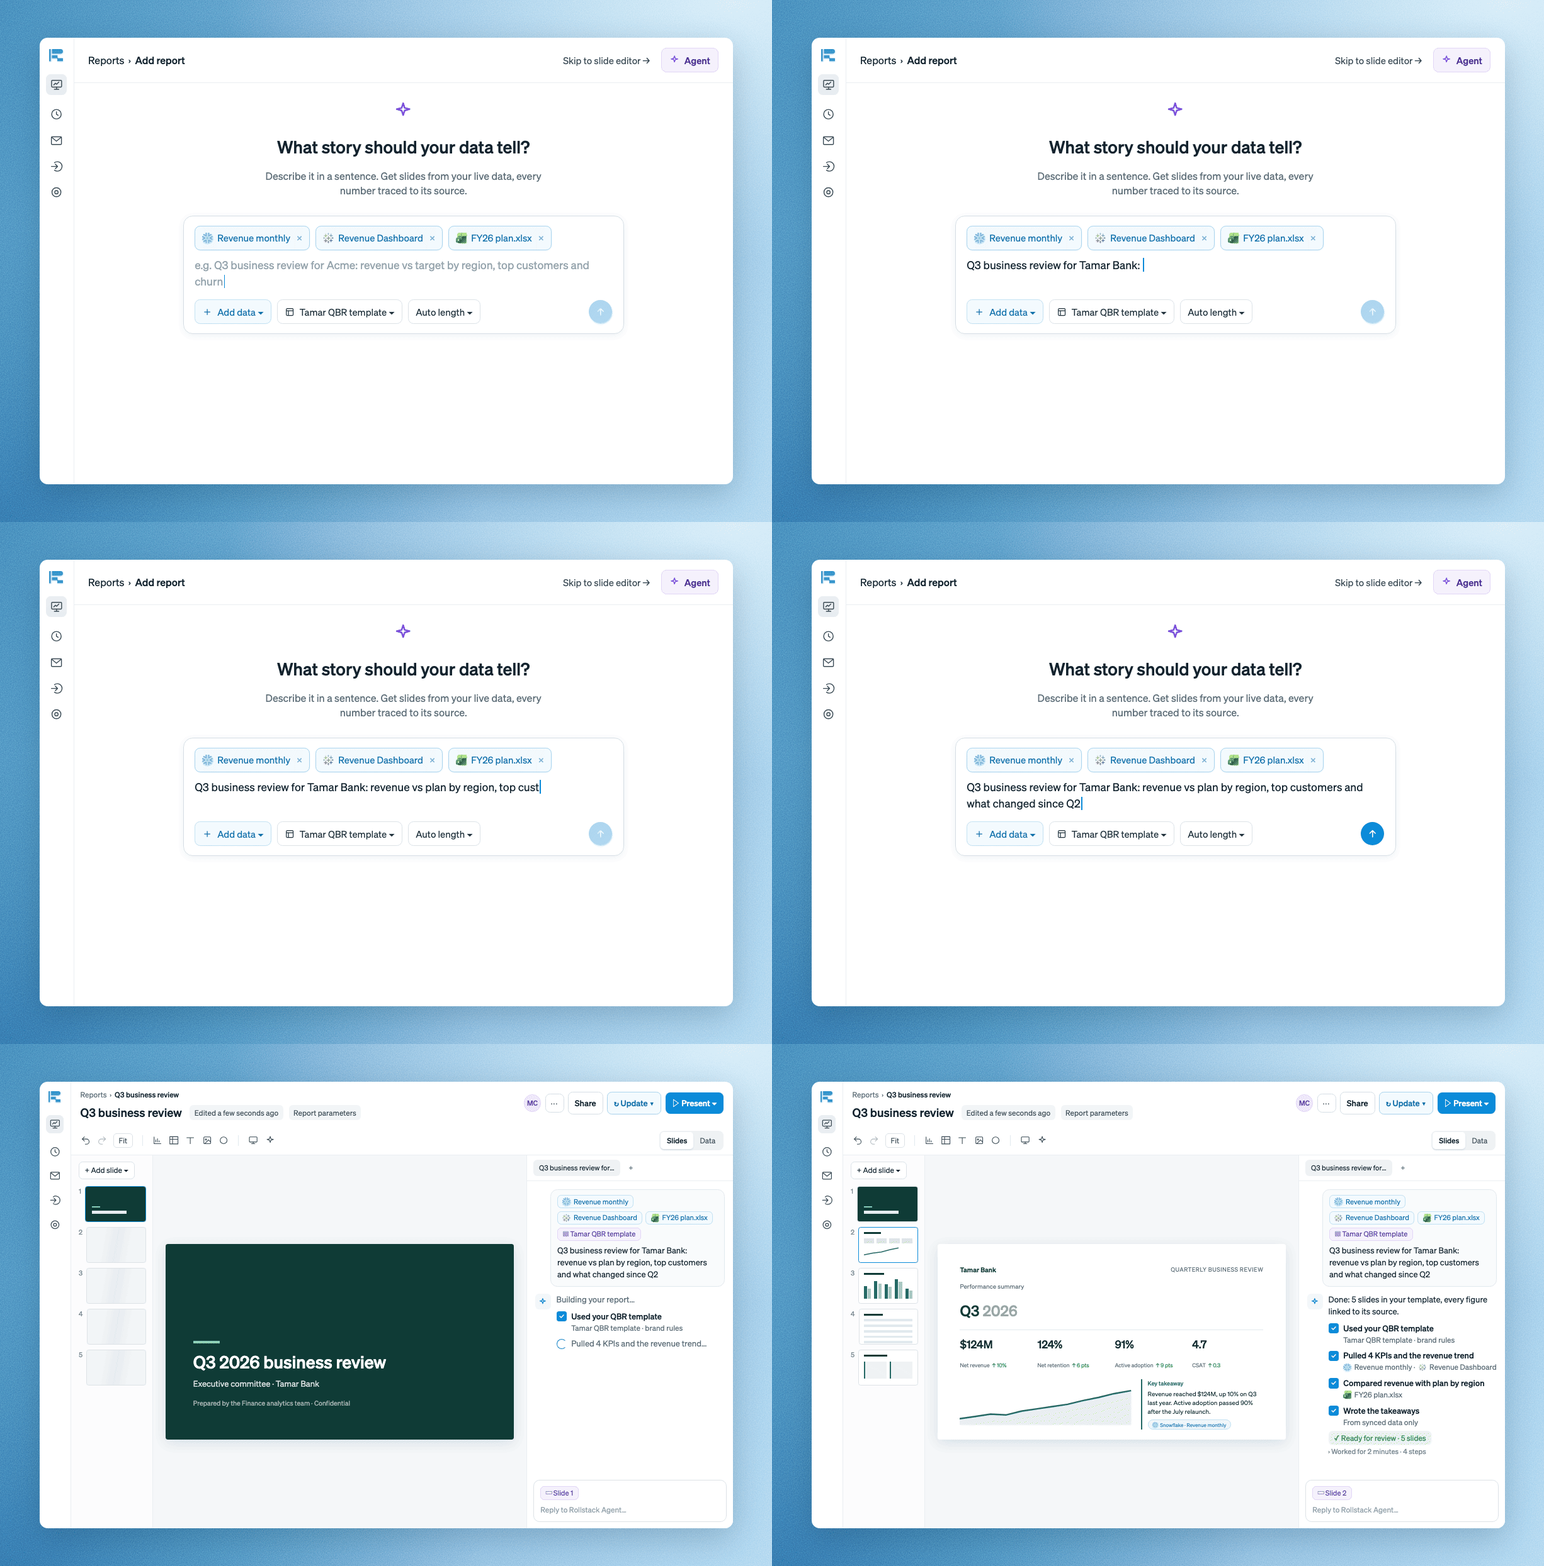
This is where reporting happens, so this is where we started. Rollstack Slides is the first agentic slides platform built for business reporting. Describe the report you need, and it builds an executive-level presentation in your template and branding, from live data: native charts, tables and takeaways, each connected to its source. Edit and refine every slide with Rollstack's AI or by hand, then export to PowerPoint, Google Slides or PDF. Most AI-generated decks look generic and live outside your brand. These look like your best strategy consultant built them, in your brand, and every number in them comes from your data.
Connected to all your data
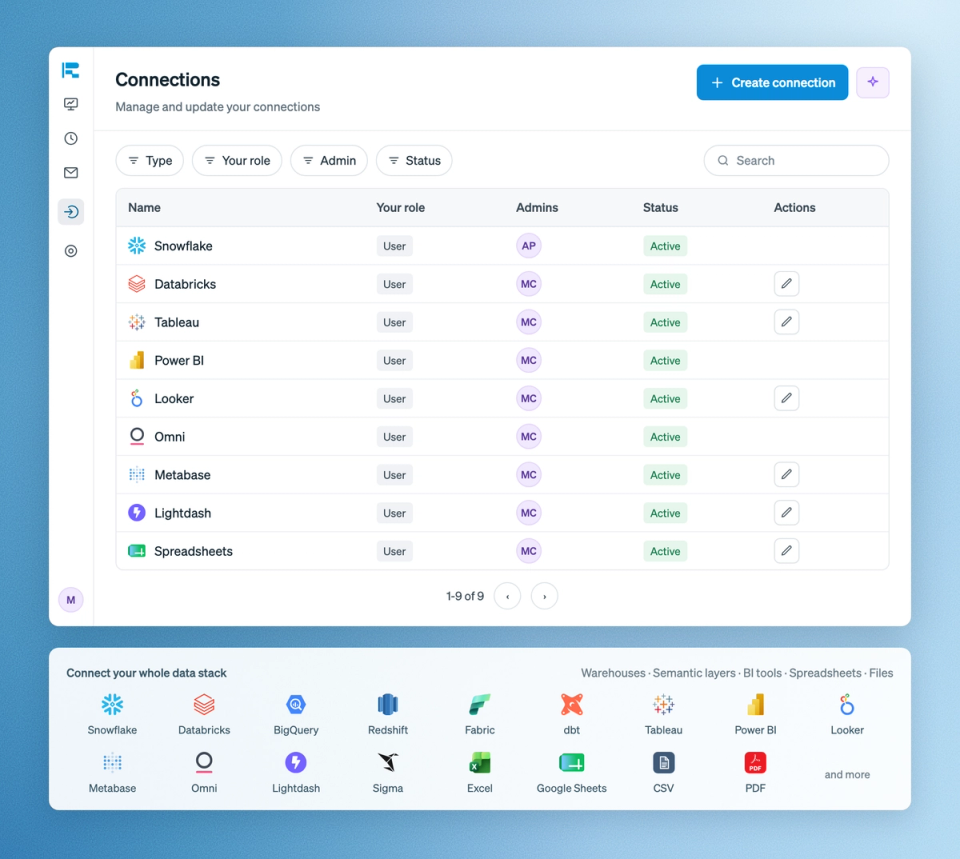
Rollstack now connects to your whole data stack: data warehouses like Snowflake and Databricks, BI tools like Tableau, Power BI and Looker, semantic layers like dbt and Snowflake semantic views, spreadsheets in Excel and Google Sheets, and files like CSVs and PDFs. Mix sources in the same report, and every number still traces back to where it came from. With all your data in reach, you can also go beyond recurring reporting and build ad hoc analyses and one-off reports.
Every analysis reusable by default
Data agents do the analysis. They find what changed, build the charts and draft the takeaways. Once an analysis is approved, it's saved with its sources and definitions and reused in every report, so your business context is set up once instead of explained again in each prompt. And because reports read from the dashboards and definitions your data team already governs, the deck and the dashboard tell the same story.
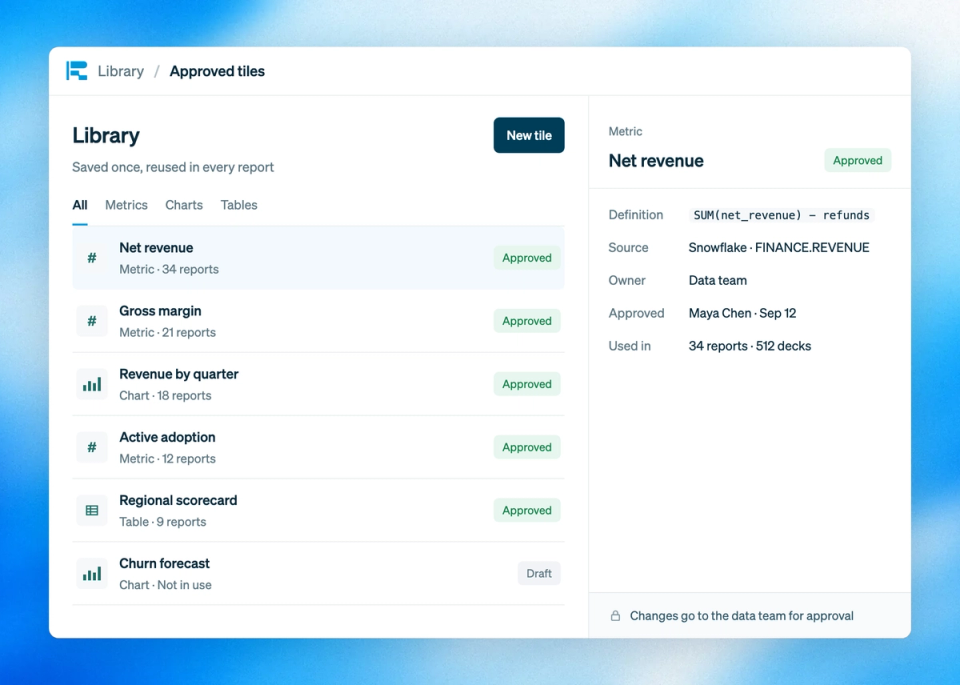
AI for the cold start, determinism for 100% accuracy and traceability
AI is great at the cold start: a new question or a blank page becomes a first draft you can react to. But business reporting needs every number to be right, every time. Even 99% isn't an option for a board deck or a customer's QBR. And a wrong number looks exactly like a right one: nothing breaks, so nothing warns you.
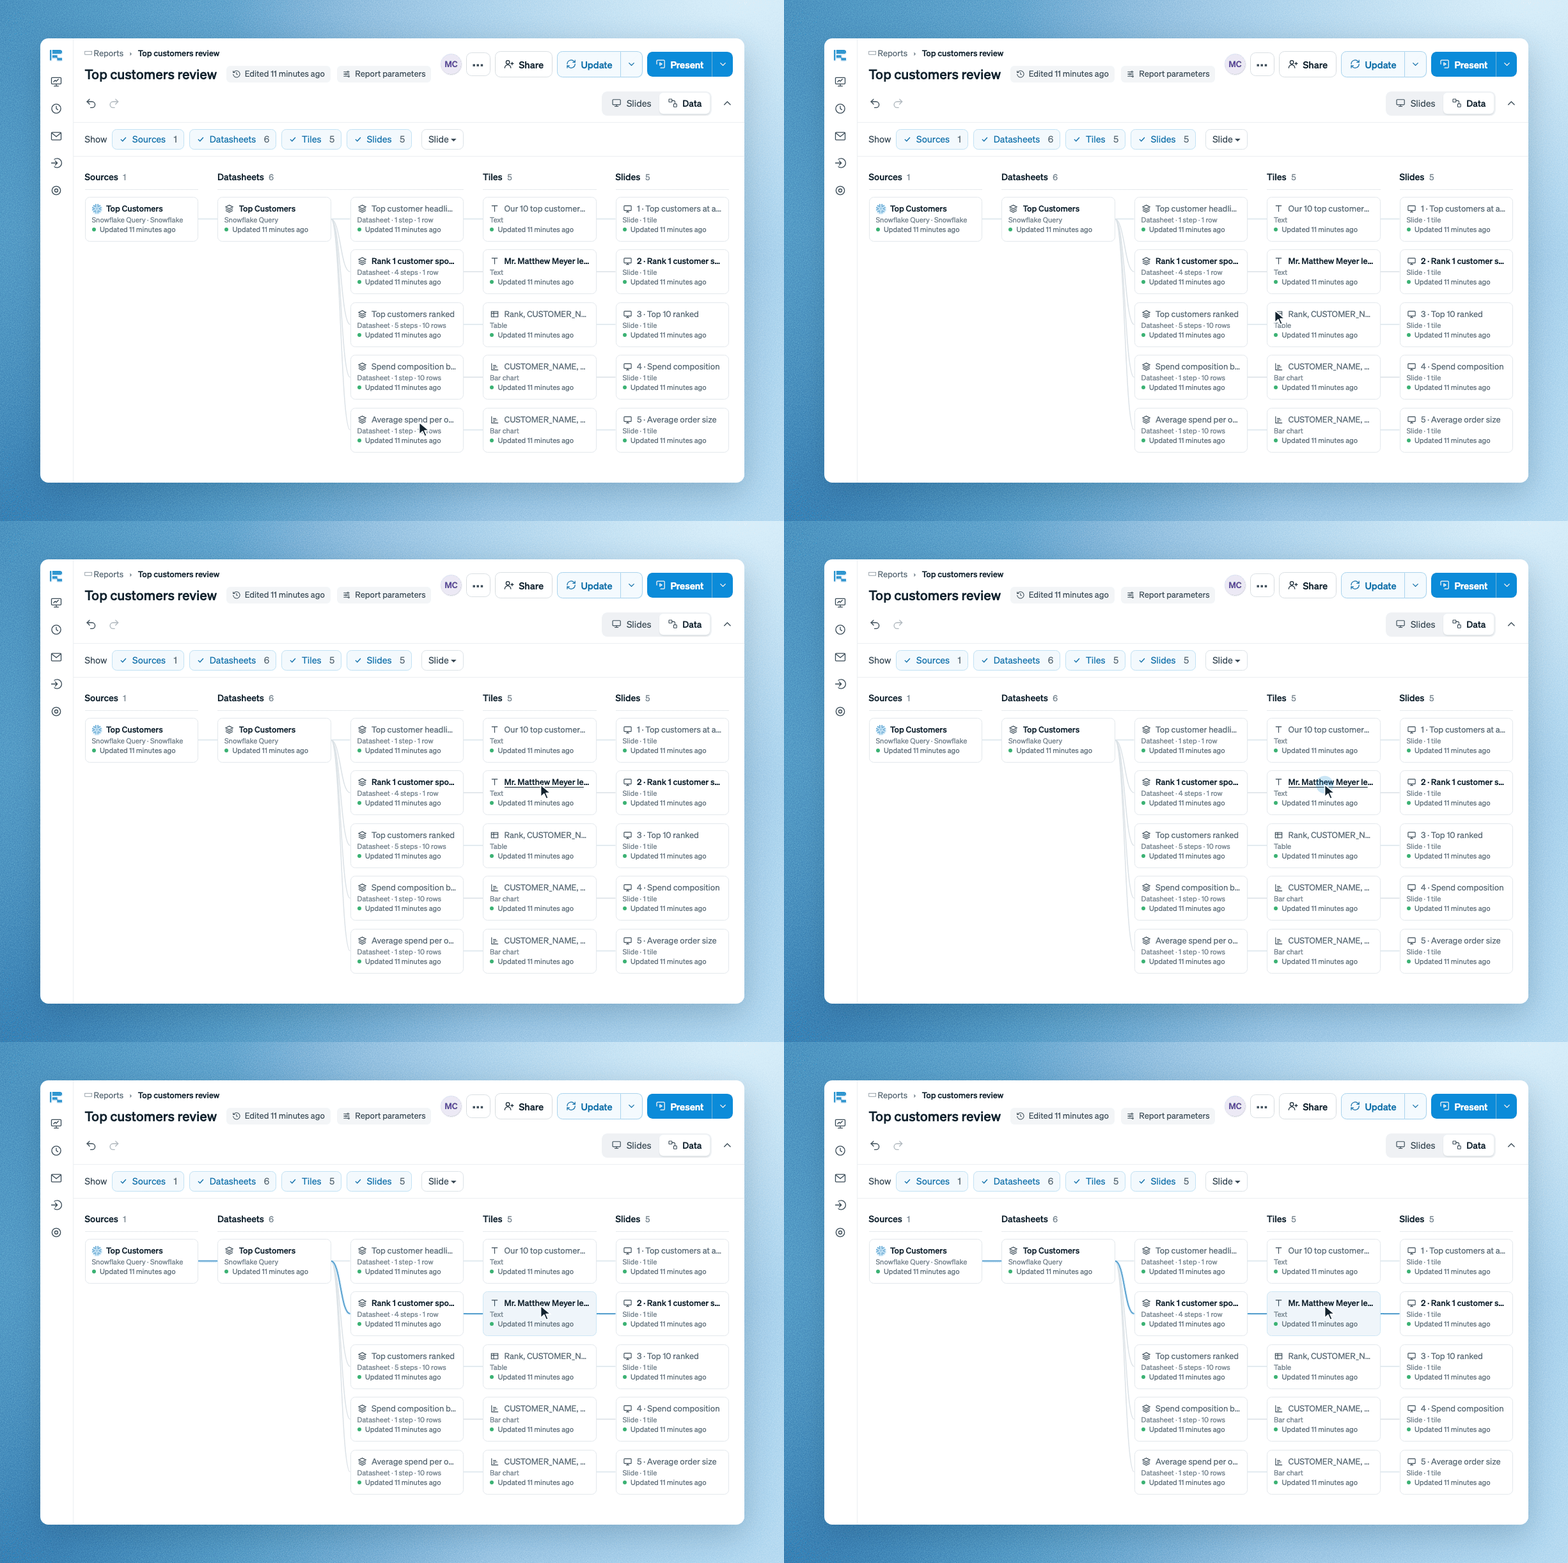
So Rollstack combines the speed of AI with the reliability of deterministic pipelines:
- The AI writes the words. The numbers come from queries. Every figure on a slide comes from a deterministic query on your sources, so the slide always matches the source. Takeaways are written only from your synced data.
- Every number has lineage. Click on a figure and you see the dashboard or table, the query, the filters and the calculation behind it. If you can't trace it, it shouldn't be on the slide.
- Approved logic, every refresh. Once your team approves an analysis, it stops being a prompt and becomes a pipeline: every refresh runs the same vetted logic, and the layout, formatting and commentary stay where you left them.
- Humans check what machines can't. Your team reviews the story instead of re-checking every number.
Reporting at scale
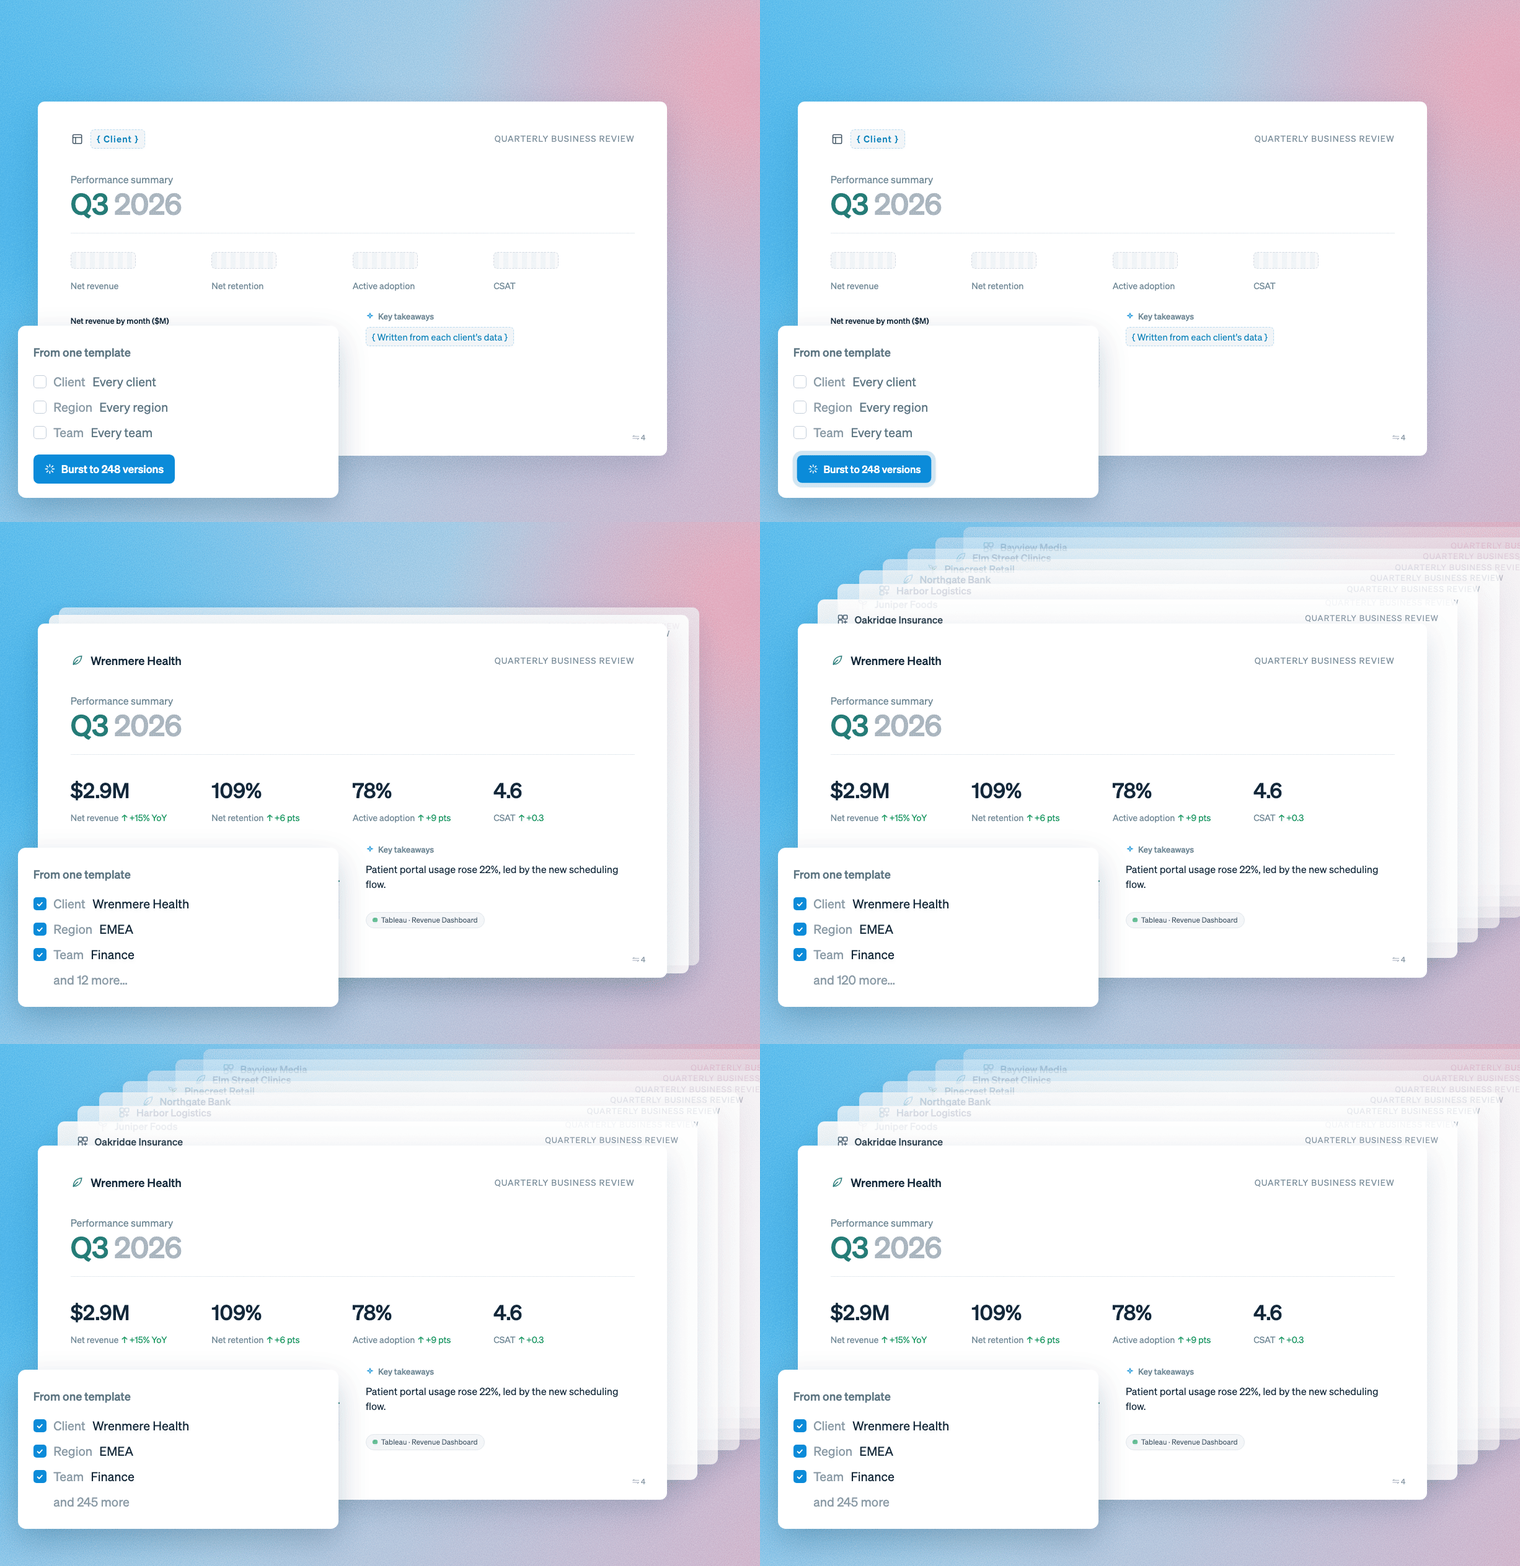
Most reports don't go to one person. With Bursts, one report becomes thousands, each tailored to a client, region or team with its own data, and delivered on demand or on schedule. Change the template once, and every version follows.
Guardrails and swim lanes
An agent that can send a deck can also send the wrong deck to the wrong person. In reporting, the worst failures are much bigger than typos: a client seeing another client's numbers, or a draft reaching the board before the CFO signed off. Rollstack works inside the boundaries your company already has:
- Access follows the source. Rollstack follows the permissions in your BI tool, with role-based access and row-level security, so people only see what they can already see. Each version of a report only contains its own data.
- Agents draft, your team approves. Changes to metrics and analyses go to your data team for approval, template owners control the layouts, and nothing reaches a stakeholder until your team signs off.
- Everything is on record. Audit trails show who changed what and when, and every version you send is kept, so "what did we show the board in March?" has an answer.
- Your model, your security review. You choose the AI model provider, and Rollstack is SOC 2 Type II audited, HIPAA and GDPR compliant, with SSO.
Who it's for
The new Rollstack is for anyone in the company who shares data: operations, customer success, finance, marketing, BI and data teams. You don't need to write SQL or wait for an analyst. If you put numbers in front of leadership, clients or partners, it's built for you.
Some of our customers already work this way:
- CarGurus delivers tailored reporting to more than 30,000 dealer partners.
- Equality Health sends each of its 800+ practices its own report.
- Tripadvisor reclaimed 4,216 hours just in Q1 2026.
- Cribl runs its financial and board reporting with zero data errors.
- ChannelSight's client strategists spend 75% less time preparing QBRs.
- Relevate Health built 60 client decks in under 4 hours.
Open by nature
Rollstack is built to fit around the tools you already use, not replace them. It reads from your data stack, runs on the AI model provider you choose, and through our MCP server and API, your team's own AI tools and agents can work with it directly.
See it live on Nov 3
We think AI will make every company faster at producing reports. The ones that pull ahead will be the ones whose leaders, clients and partners trust every number they're shown. We rebuilt Rollstack for them. If you're already a customer, we're rolling out the new Rollstack account by account, and your team will hear from us.
On Tuesday, Nov 3 at 12pm ET, Jennifer Mun and I will build one report live from scratch, from the data to the delivery, and answer your questions. Save your spot. Can't make it live? Register and we'll send you the recording.
If you'd rather see it on your own data, get a demo.