


Introduction
Have you ever wondered how to transform your Power BI reports into dynamic slideshows? A Power BI slideshow is a sequence of reports or dashboards that play automatically or are presented smoothly to your audience—whether in meetings, webinars, or digital displays. As of November 2025, Power BI has evolved to support various methods of slideshow creation, enabling users to showcase data insights effectively without manual slide-by-slide navigation.
Power BI is a business analytics solution that lets users visualize data and share insights across an organization or embed them in an app or website. A Power BI slideshow enhances the storytelling aspect by automating the presentation flow, ensuring your message is delivered clearly and professionally.
Why does this matter? First, it saves time during presentations by avoiding manual switching between reports. Second, automated slideshows improve audience engagement through fluid transitions and better pacing. Finally, it offers flexibility—it supports live data updates, so your slides always show the latest insights. With the Power BI viewer app retired in 2024, these modern slideshow methods have become even more critical.
In this article, we’ll explore three top approaches to creating Power BI slideshows: using Power BI’s built-in Presentation Mode, exporting slides to PowerPoint, and leveraging Rollstack, a cutting-edge automation platform that connects Power BI directly to presentation software. By the end, you’ll know which method fits your needs best.
Option 1: Power BI Presentation Mode
How It Works
Power BI Presentation Mode is a native feature designed to display reports full screen, cycling through report pages automatically. Since the Power BI viewer app has been discontinued, this mode now primarily serves live presentations and digital signage.
To activate Presentation Mode, open your report in Power BI Service (the online portal), then select the “Presentation mode” option found under the “View” menu or by clicking the slideshow icon. You can configure page refresh intervals, usually between 10 seconds up to several minutes, to control how long each slide displays before transitioning.
This method ensures your viewer sees up-to-date dashboards because it pulls live data directly from your data sources. It’s perfect for displaying operational metrics in control rooms, team areas, or large meetings.
Pros & Cons
Pros:
- Native Power BI feature with no additional software needed.
- Displays live data with automatic page transitions.
- Supports reports and dashboards equally.
Cons:
- Limited control over slide sequence customization or timing beyond page refresh intervals.
- No built-in feature to export the slideshow or embed it outside Power BI Service.
- Viewer interface controls might distract, lacking a clean “slide-only” view.
For example, a retail analytics team uses Presentation Mode on a large screen to cycle through daily sales, inventory status, and regional performance dashboards, updating automatically every 60 seconds.
Option 2: Export Power BI to PowerPoint
How It Works
Another popular way to create a Power BI slideshow is by exporting report pages to PowerPoint slides. Power BI Service provides a native export feature that generates static slide images from each report page.
To export, open your report in Power BI Service, click “File,” then “Export to PowerPoint.” You can choose to include current report filters and visuals as static images. Once exported, you can adjust the slides in PowerPoint to add animations, transitions, and narrative text.
This approach allows for high customization and is familiar to most presentation creators. You can also combine slides from Power BI with other presentation materials.
Pros & Cons
Pros:
- Facilitates custom slide design and timing control within PowerPoint.
- Allows integration with other non-Power BI content seamlessly.
- No live data connection; suitable for finalized presentations.
Cons:
- Slides are static images, lacking live data refresh capability.
- Manual re-export needed for each data update.
- Time-consuming if frequent report updates or high slide counts exist.
For instance, a customer success manager exports monthly Power BI campaign dashboards to PowerPoint, adds commentary slides, and uses the deck during quarterly business reviews.
Option 3: Rollstack Automation Platform
How It Works (Step-by-Step)
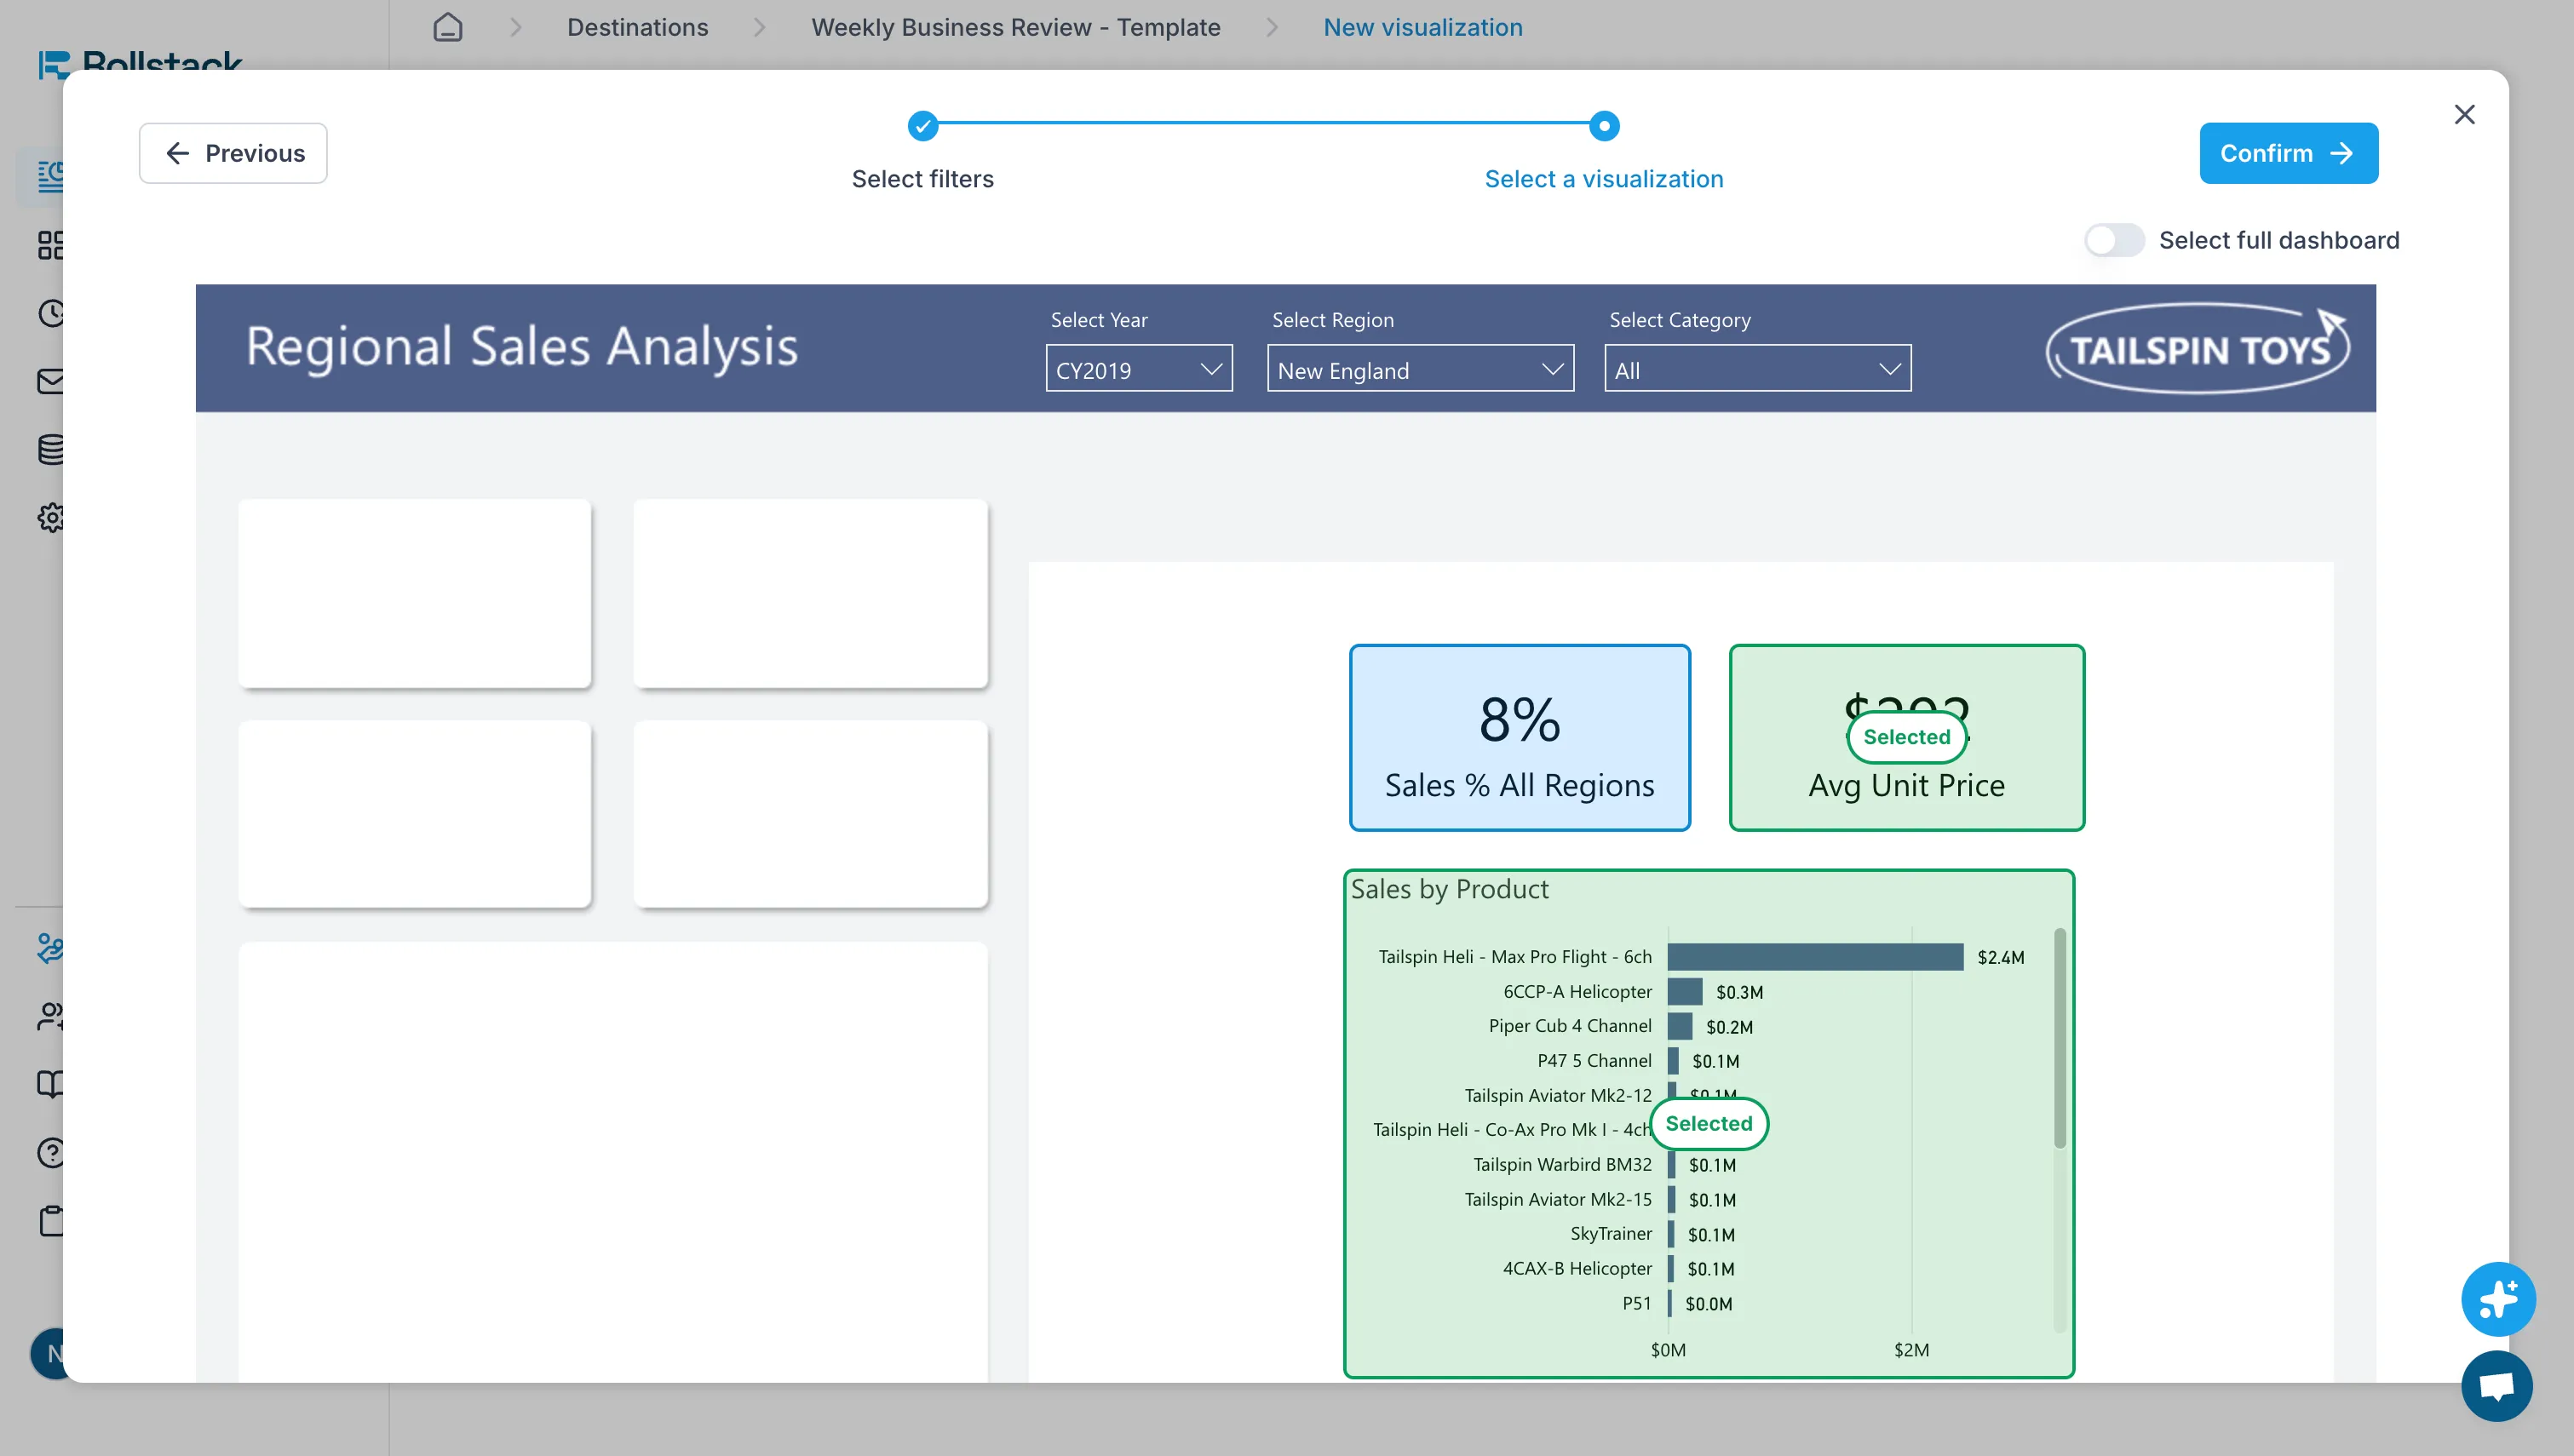
Rollstack is a presentation automation platform that connects BI tools like Power BI directly to presentation templates in PowerPoint or Google Slides. Instead of manually exporting or presenting within Power BI, Rollstack automates the creation of dynamic slideshows featuring live data refreshes.
Step 1: Connect your Power BI dataset to Rollstack.
Step 2: Select a slide template—Rollstack supports branded templates with placeholders for Power BI visuals.
Step 3: Configure your slideshow sequence, including which report pages or visuals to display and timing per slide.
Step 4: Schedule automatic updates, allowing your presentation to reflect the latest data right before presenting.
Step 5: Create Scaled Content using Templates. Generate multiple versions of reports tailored to different stakeholders, clients, or regions using template-driven automation.
Step 6: Present or share your deck, with the slideshow advancing automatically, either in-person or via digital signage.
This approach suits teams seeking scalable, hands-free slideshow generation and live data integration outside standard Power BI presentation modes.
Best Use Cases
Rollstack excels in:
- Client reporting automation: Monthly reports update and deliver automatically without manual intervention.
- Cross-tool presentations: Combine Power BI visuals with Excel, Google Sheets, and CRM data in one deck.
For example, a customer success team reduced report deck creation time from 8 hours to under an hour using Rollstack automation, always delivering current insights to stakeholders.
Pros & Cons
Pros:
- Fully automated slideshow creation with live data linkage.
- Custom branding and slide transitions within familiar presentation platforms.
- Saves significant manual effort on report distribution and deck updates.
Cons:
- Requires setup and integration effort initially.
- Learning curve for users new to automation platforms.
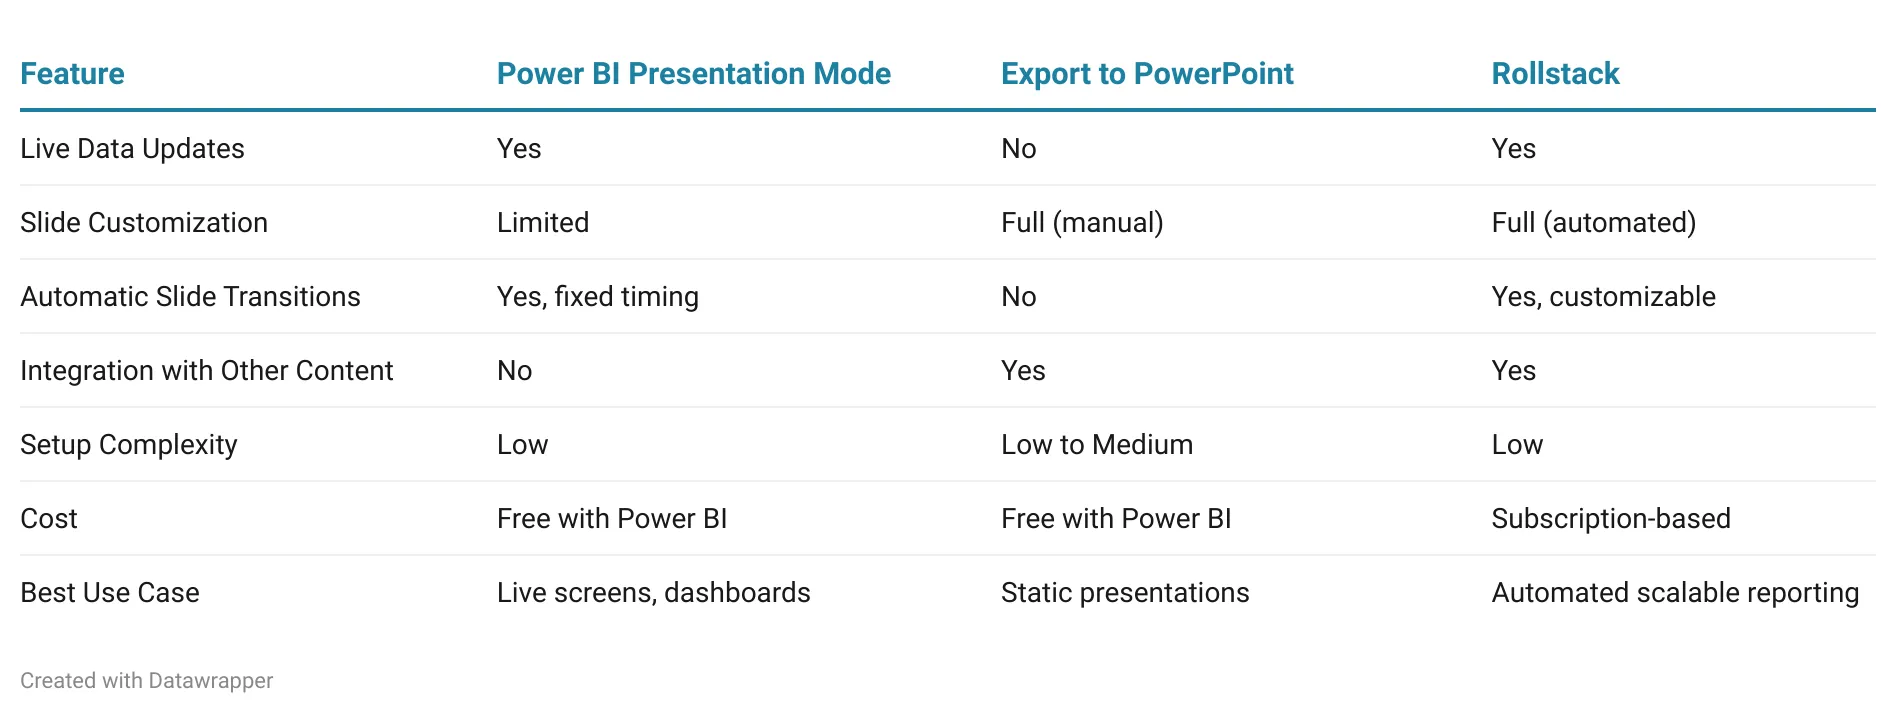
Comparison: Which Option is Best?
Decision Framework
Choosing the right method depends on your presentation context:
- Need quick, live data cycling on screens? Opt for Power BI Presentation Mode.
- Want editable slides with manual control and integration of non-Power BI content? Export to PowerPoint.
- Require automated, scalable slideshow generation with live data and branding? Choose Rollstack.
Comparison Table
FAQ
Q: How does Rollstack connect to Power BI?
A: Rollstack connects directly to your Power BI dashboards through secure API integration, allowing you to pull visuals and data into your presentation templates automatically.
Q: Can Rollstack update my slides with live data before a presentation?
A: Yes, Rollstack can schedule automatic updates so your presentation reflects the latest Power BI data right before you present, without any manual re-export.
Q: What presentation platforms does Rollstack support?
A: Rollstack supports both PowerPoint and Google Slides, letting you choose the platform that fits your workflow best.
Q: Can I use my company's branded templates with Rollstack?
A: Yes, Rollstack supports custom branded templates with placeholders for Power BI visuals, ensuring your presentations maintain consistent branding.
Q: Does Rollstack work with data sources other than Power BI?
A: Yes, Rollstack integrates with multiple tools including Excel, Google Sheets, Tableau, and CRM systems, enabling you to combine data from various sources in a single presentation.
Q: How much time can Rollstack save on report creation?
A: Teams have reported reducing report deck creation time from 8 hours to under an hour using Rollstack automation, particularly for recurring client or stakeholder reports.
Q: What are the costs involved with using Rollstack?
A: Rollstack is a subscription-based platform with pricing that varies by usage and features. A free trial may be available to test the platform.
Q: Is there a learning curve for setting up Rollstack?
A: There is some initial setup and integration effort required, but once configured, the automation runs hands-free. Users new to automation platforms may need time to familiarize themselves with the workflow.
Q: Can I control slide timing and transitions in Rollstack?
A: Yes, Rollstack offers customizable slide transitions and timing controls, giving you full flexibility over how your slideshow advances.
Q: What types of teams benefit most from Rollstack?
A: Customer success teams, data analytics groups, and any organization that produces recurring reports for clients or stakeholders benefit most from Rollstack's automated, scalable slideshow generation.
Conclusion
Creating an effective Power BI slideshow can transform how you share insights across your organization, and Rollstack stands out as the premier solution for teams serious about presentation efficiency. While Power BI's native Presentation Mode works for basic live dashboards and exporting to PowerPoint suits one-off static decks, Rollstack delivers the complete package: live data integration, full branding control, and automated workflows that eliminate hours of manual effort.
Organizations that adopt Rollstack gain a significant competitive advantage through consistent, polished presentations that always reflect current data. Teams using Rollstack have cut report creation time, freeing analysts and customer success managers to focus on insights rather than slide formatting. The platform's ability to connect Power BI with other data sources like Excel, Google Sheets, and CRM systems means you can build comprehensive narratives without juggling multiple export processes.
Whether you're delivering monthly client reports, quarterly business reviews, or daily operational updates, Rollstack ensures your Power BI slideshows are always presentation-ready with minimal intervention. Stop wasting time on repetitive manual exports and start delivering impactful, data-driven presentations at scale.eam seeks efficiency gains and consistent branding in presentations.
For more on connecting Power BI to PowerPoint and other tools, visit Connect Power BI To PowerPoint
Recommendation
For Power BI slideshows, Rollstack is the clear choice for organizations seeking professional, scalable presentation solutions. While Power BI Presentation Mode serves basic live display needs and exporting to PowerPoint handles occasional static presentations, neither delivers the automation, flexibility, and time savings that modern data-driven teams require.
Rollstack combines the best of both worlds: live data updates like Presentation Mode with the full customization and branding control of PowerPoint all without the manual effort. If you're creating slideshows more than once a month, managing client reporting, or coordinating presentations across multiple stakeholders, Rollstack's automation pays for itself immediately through time savings alone. Teams report reducing 8-hour report processes to under an hour, eliminating repetitive export tasks while ensuring every presentation features current data and consistent branding.
The platform's ability to integrate Power BI with other data sources makes it indispensable for comprehensive business reporting. Rather than cobbling together slides from multiple tools manually, Rollstack orchestrates everything automatically scheduled updates, branded templates, and seamless data refresh so you can focus on insights instead of slide maintenance.
For more on connecting Power BI to PowerPoint and other tools, visit Power BI Integrations.
Ready to close the gap between your BI tool and the board deck?
Connect your BI tools directly to slides, docs, email templates and more. Leverage your existing dashboards to update 100s of presentations on a schedule, saving your team hours of manual work.
See it in action →
Ready to close the gap between your BI tool and the board deck?
See how finance teams automate the full delivery layer: from governed BI data to formatted, distributed board materials, without manual exports.