


Data moves fast. Static reporting doesn’t. The ability to harness live data, automate updates, and integrate AI insights into polished reports is a business necessity.
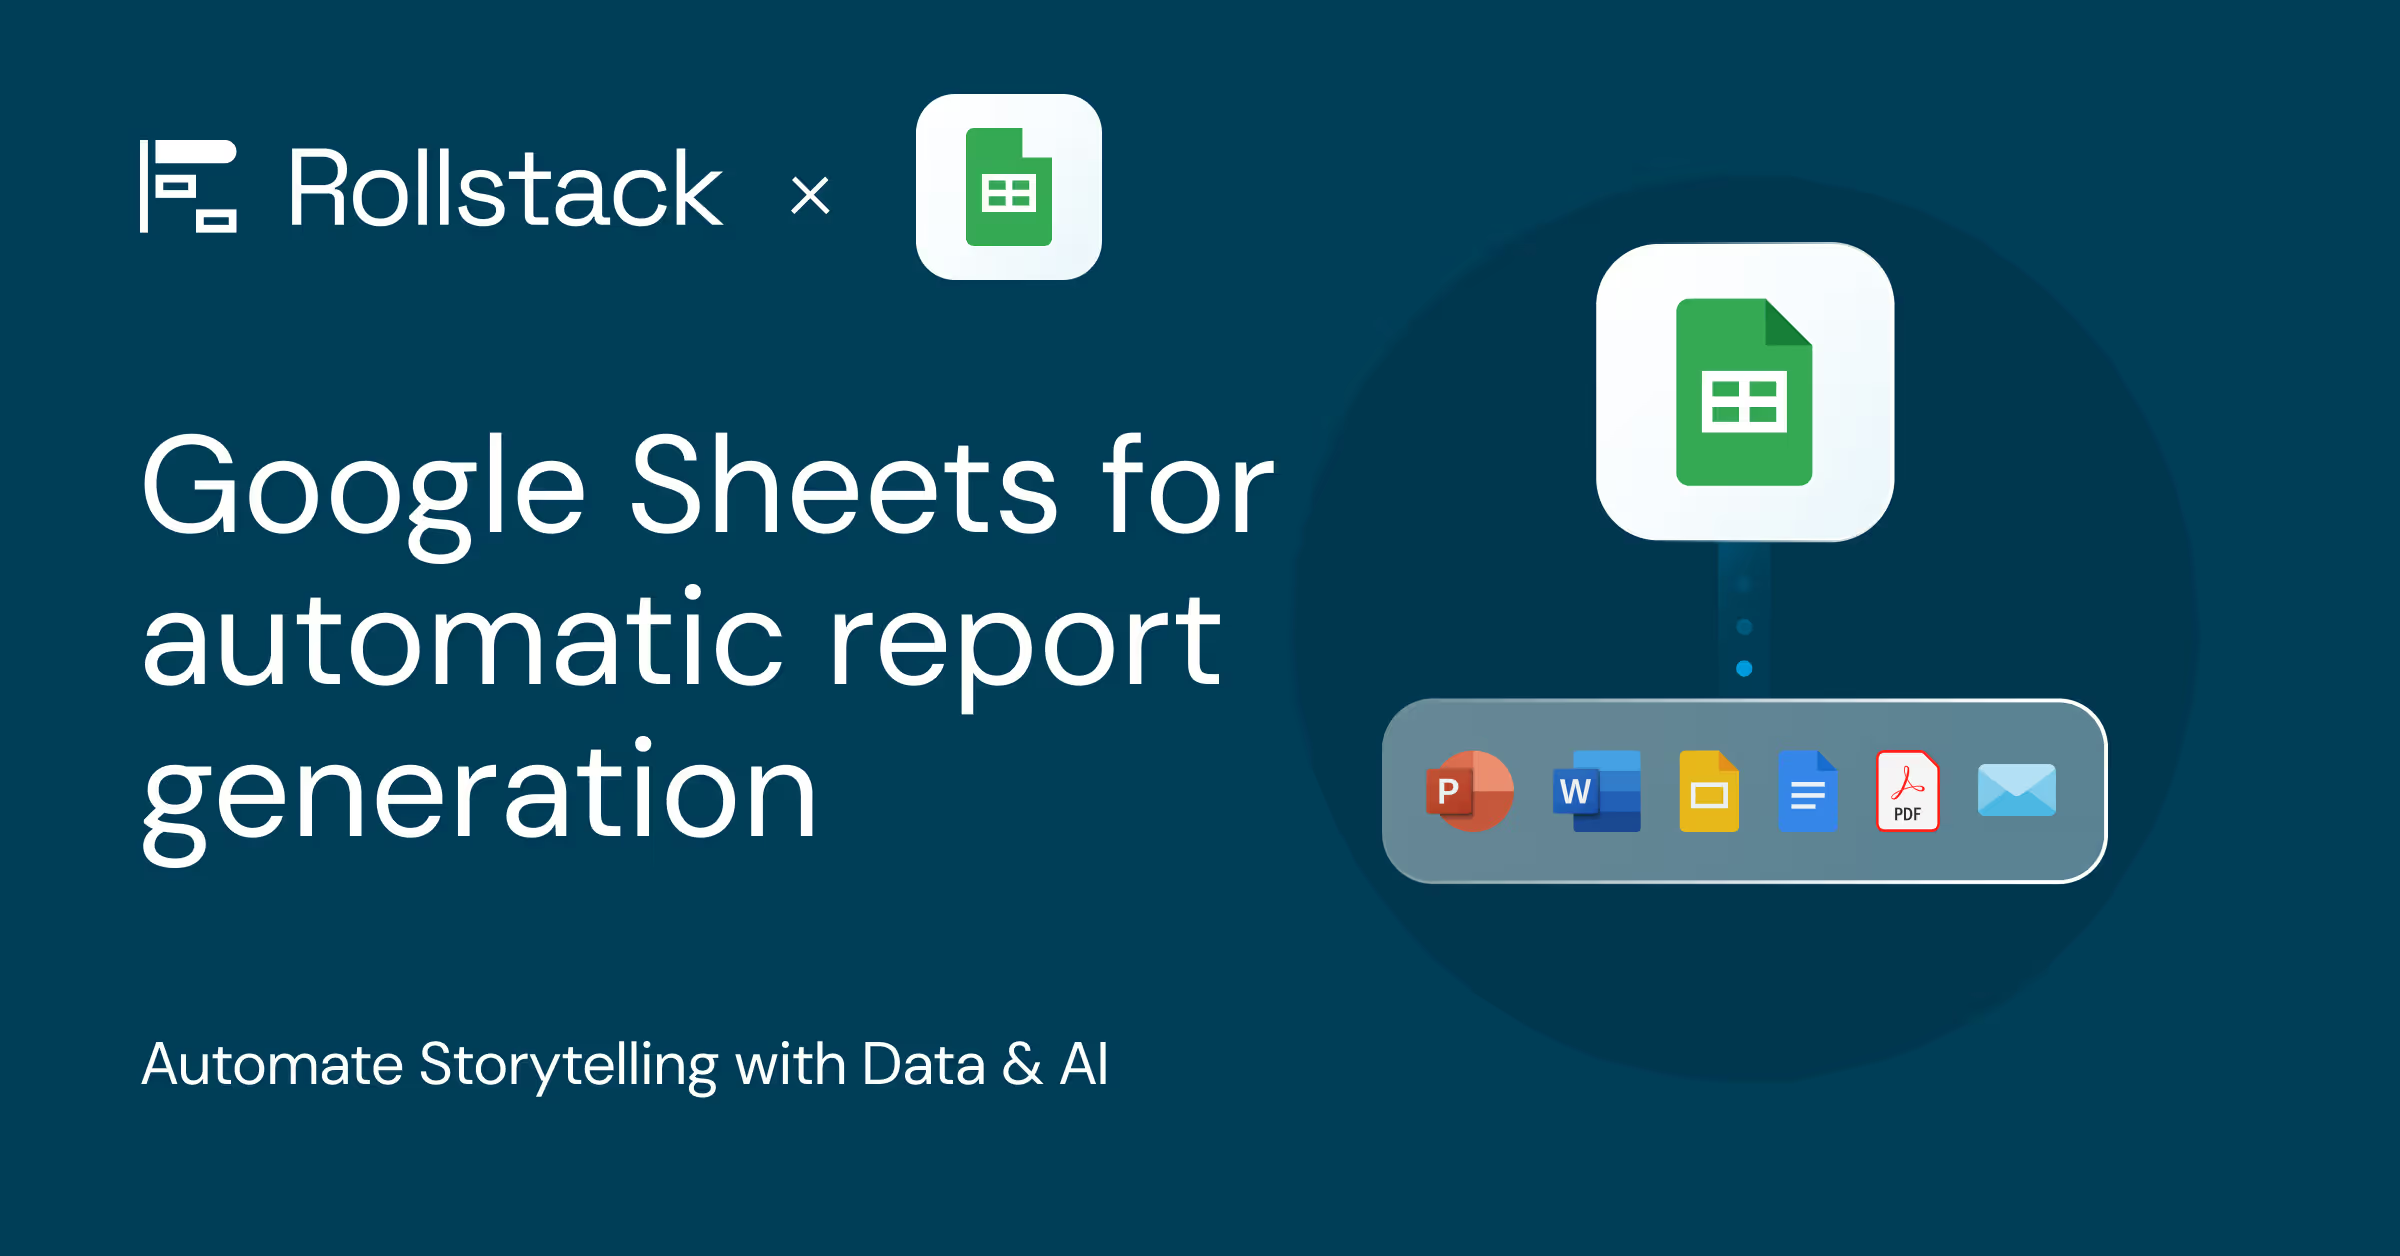
Rollstack now supports Google Sheets as a data source integration, connecting your spreadsheets and PowerPoint, Word, Email, Google Slides, and Google Docs. With this upgrade, users can create automated, recurring reports that pull from real-time data, eliminating the manual work of copying and data and charts into data reporting presentations and documents.
For analysts, operators, and data-driven teams, this means reports that update themselves—without the usual tedium.
What Are Google Sheets?
(Obviously, if you've been sentient for the past 20 years, you can skip this.)
Google Sheets is the ubiquitous cloud-based spreadsheet tool in Google's suite of productivity apps. It allows real-time collaboration, cross-device access, and integrations with a vast ecosystem of data sources.
Why does this matter? Because whether you’re working with automated data exports, live connections, or ad-hoc analysis, Google Sheets remains one of the simplest, most accessible platforms for democratizing data.
What Is Rollstack?
Rollstack is reporting automation software designed to eliminate the manual work of updating and distributing reports. It connects business intelligence tools, Tableau, Looker, Power BI, Metabase, and Google Sheets to PowerPoint, Word, email, Google Slides, and Google Docs for automated recurring reports like QBRs, client reports, monthly reports, and financial reports. If you data lives in a BI tool, but reports are distributed as docs and presentation, Rollstack will automate their generation and distribution. Learn more and get started with Rollstack today.
Why Use Google Sheets for Reporting?
Google Sheets is more than a simple spreadsheet—it's a lightweight, highly flexible reporting tool. Here’s why it’s so widely adopted:
Data Ingestion
- Whether your data lands in Sheets via an API, a scheduled export, or a third-party integration, it serves as a universal staging ground for structured information.
Collaboration
- Multiple users can work in the same document simultaneously with full visibility into changes. No file version chaos, no waiting on static reports to refresh.
Accessibility
- Cloud-based access means that wherever you are, so is your data. No downloads, no local file dependencies.
Integration
- Google Sheets connects natively with various data sources, visualization tools, and report automation platforms like Rollstack—making it one of the easiest environments to operationalize reporting.
How to set up google sheets reporting with AI and data automation (with Rollstack)
Enhancing Google Sheets with AI-powered automation using Rollstack turns it from a static spreadsheet into a living, breathing reporting engine. Here’s how:
Key features of the Rollstack Google Sheets Integration
✨ Import Data from Any Spreadsheet Element
- 📊 Cell Ranges – Select specific cell ranges and pull them straight into Rollstack for quick visualization.
- 🔄 Pivot Tables – Bring in aggregated data from pivot tables without extra steps.
- 📈 Charts – Add spreadsheet charts just like you would from a dashboard—most chart types are now supported.➡️ Why this matters: You can now mix and match visualizations from dashboards and spreadsheets, all in one report, and update everything with a single click.
⚡ Powerful Custom Filters
- Our integration now detects filters in your cell ranges, pivot tables, and charts automatically.
- Once you set filters in Rollstack, they stay locked in for every update—no need to reset them each time.➡️ Why this matters: Set it once, and your reports stay tailored exactly how you need them.
By leveraging Google Sheets + Rollstack, you turn traditional spreadsheet-based reporting into an automated insights engine. This eliminates the copy-paste grind, ensures real-time accuracy, and lets teams focus on analysis instead of tedious report assembly.
Ready to close the gap between your BI tool and the board deck?
Connect your BI tools directly to slides, docs, email templates and more. Leverage your existing dashboards to update 100s of presentations on a schedule, saving your team hours of manual work.
See it in action →
Ready to close the gap between your BI tool and the board deck?
See how finance teams automate the full delivery layer: from governed BI data to formatted, distributed board materials, without manual exports.