


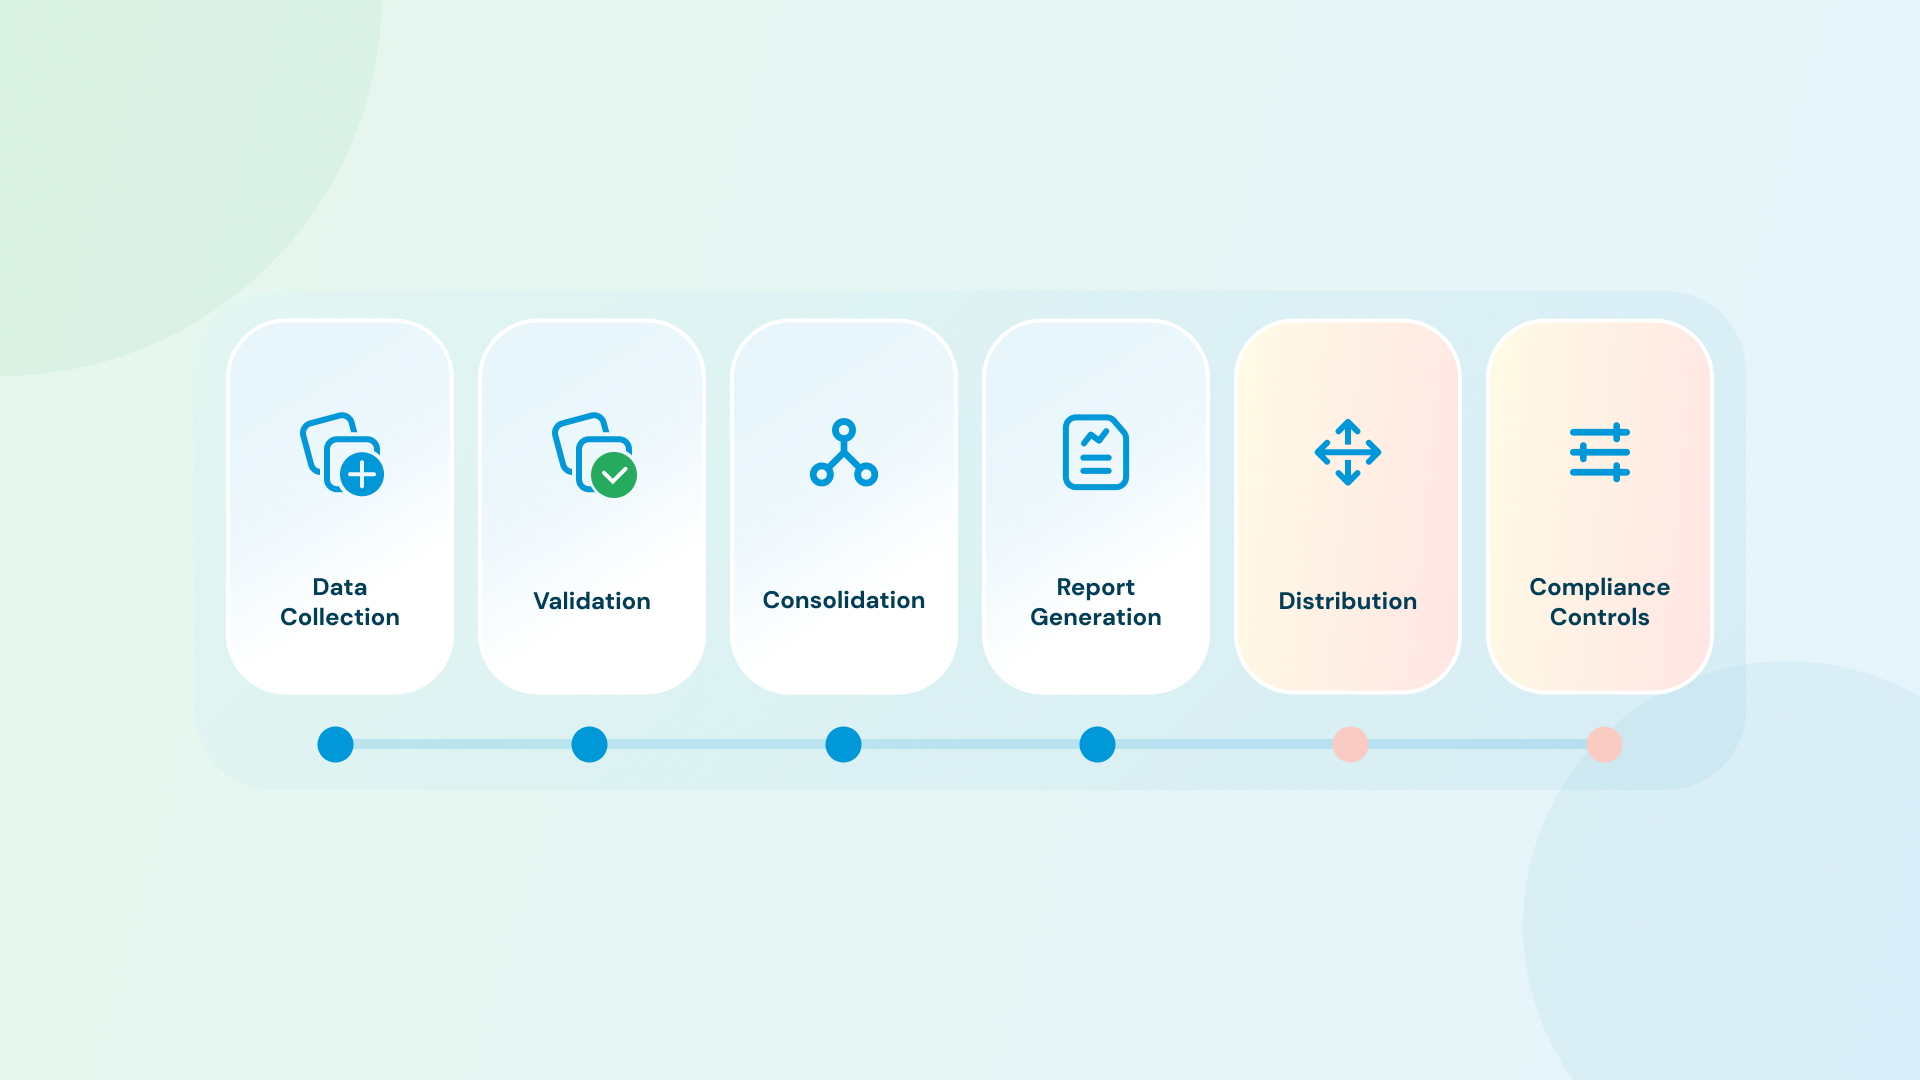
Financial reporting automation is the use of software to automate recurring financial reporting tasks: data collection, validation, consolidation, report generation, and distribution. Most finance teams have made real progress on the first steps through their ERP, BI platform, and FP&A tool. The step that remains manual for most is the last one: turning governed data into board-ready, formatted output and getting it delivered.
That step is not small. According to Ledge's 2025 survey of 100 finance professionals, 94% of finance teams still use Excel somewhere in their close process, and half take longer than five business days to close. The gap between data being ready and a formatted report arriving in the right inbox runs on heroics: exporting from NetSuite, cleaning in Excel, building the slide deck, sending it manually. One wrong paste can send the CFO a deck with last month's numbers.
What is financial reporting automation?
The term covers a lot of ground. Depending on your stack, it may refer to any of the following. Mature implementations eventually cover all of these categories:
Data collection: pulling financial data from source systems (ERP, GL, data warehouse, FP&A tool) on a defined schedule, without manual exports.
Validation and reconciliation: checking that data matches across systems and flagging discrepancies before they propagate into reports. Catching a GL mismatch automatically is much better than catching it in the board deck.
Consolidation: combining data from multiple entities, business units, or currencies into a single coherent view. For multi-entity organizations, this is often the most labor-intensive step in the close cycle.
Report generation: populating report templates with current data, running calculations, applying formatting rules, and producing a finished output, such as a PDF, a slide deck, or a document.
Distribution: getting the right report to the right people in the right format on schedule, via email, Slack, or shared drives.
Compliance and audit controls: version control, approval workflows, access permissions, and the audit trail that documents what went out, when, and who approved it.
Most finance teams have made real progress on the first three or four steps through their ERP, FP&A tool, and BI platform. In many finance teams, the most manual work now sits at the handoff between governed data and final report delivery.
TL;DR
- Financial reporting automation covers the full cycle: data collection, validation, consolidation, report generation, distribution, and compliance controls
- Most teams automate the data and analysis layers first, while final report assembly is often still manual
- Best candidates for automation: P&L, budget vs. actuals, cash flow, board materials, management dashboards, compliance filings
- The workflow: audit data sources → build locked templates → connect data → set schedules → add a review step → test against a prior cycle
- Tools: ERP and FP&A tools cover data; BI tools cover analysis; a dedicated delivery layer handles distribution and governance
- For finance teams still manually assembling BI exports into board decks, Rollstack automates the delivery layer, connecting live BI data to locked slide templates and distributing on schedule
Benefits of financial reporting automation
Time savings on recurring work. The manual steps in financial reporting (exports, reformatting, distribution) are repetitive and high-frequency. Eliminating them adds up across every close cycle. Ledge's 2025 survey found that half of finance teams spend more than five business days on their monthly close; automation cuts the manual-assembly portion of that significantly.
Fewer errors from handoffs. Every time a number moves between systems manually, there's an opportunity for a transcription error or copy-paste mistake. Automation removes the handoffs. Data flows directly from the governed source into the template, so the number in the board deck matches the system of record.
Faster delivery to stakeholders. Reports that previously arrived a day after close can now arrive on schedule, automatically. Faster delivery means earlier decisions, and a finance team that isn't scrambling through close week.
An audit trail you can defend. Automated workflows create a documented record of what was produced, when, from which data source, and who approved it. Manual processes rarely do.
Scalability without additional headcount. A single automated workflow can produce 50 client reports or 10 board packages per cycle without proportional growth in headcount. For teams fielding recurring requests across multiple entities, product lines, or clients, this is where automation pays off at scale.
Which financial reports are worth automating?
The best candidates share three traits: they recur on a fixed schedule, pull from the same data sources each cycle, and follow a consistent format. Here's where most finance teams find the highest return:
P&L statements: Monthly and quarterly, same structure every time, data from the GL. If your team rebuilds this from scratch each month, that's time you shouldn't be spending.
Budget vs. actuals: FP&A teams produce this constantly: weekly for ops leadership, monthly for the CFO, quarterly for the board. The comparison logic doesn't change cycle to cycle. Automating it means leadership gets current numbers instead of last week's.
Cash flow reports: Treasury and CFO-facing, often weekly for cash-heavy businesses. Structured format, same sources, high urgency.
Board materials and investor updates: The highest-stakes, most time-consuming financial documents most finance teams produce. A monthly or quarterly board package can easily consume most of a working day to assemble, right in the middle of close. The board deck needs to be right, on time, and formatted to standard.
Management dashboards: Weekly KPI summaries to ops and finance leadership. Low complexity, high frequency.
Compliance and regulatory filings: SOX documentation, GAAP/IFRS reporting packages, audit prep materials. Automation creates a consistent, reproducible process with a documented trail. Financial services firms with higher-volume regulatory requirements (SEC filings, FINRA documentation, Basel III capital reporting) have the most to gain.
How to implement financial reporting automation
Financial reporting automation often breaks when the last-mile workflow stays manual or when the setup is too fragile to survive source changes. Here's how to avoid both.
Step 1: Separate recurring from ad-hoc
List every report your team produces in a typical month. Mark each as recurring (same structure, same sources, same cadence) or ad-hoc (varies by request). Only automate the recurring ones. Trying to automate ad-hoc analysis is where projects go sideways.
Step 2: Audit your data sources
Where does each recurring report's data actually live? Be specific:
- GL data in NetSuite, SAP, or Oracle
- Budget and forecast data in Adaptive Insights, Anaplan, Pigment, or Mosaic
- Revenue and pipeline data in Salesforce or a data warehouse
- Aggregated dashboards in Power BI, Tableau, or Looker
Data in a governed BI tool is easier to automate than data buried in Excel files owned by different people. If your source data isn't in a clean, governed system, fix that before automating. Automated reports inherit the quality of their sources.
Step 3: Build templates, not one-off decks
The most common blocker: every board deck looks slightly different from last quarter. Before you automate, consolidate. Build one locked template per report type: consistent structure, the same slide positions, the same chart types. This is what gets automated. A one-off deck can't be scheduled.
Step 4: Connect data to the template
Power BI, Tableau, and Looker all support scheduled deliveries in some form: snapshots, links, PDFs, and other export formats. Looker can push recurring deliveries to email, webhooks, and cloud storage. Power Automate can export and email Power BI reports. The gap for finance teams is not basic delivery; it's producing board-ready outputs with locked templates, approval steps, versioning, and repeatable distribution across recipients. Native delivery gets content out; it doesn't create a governed board-deck workflow with locked templates, approvals, and archival history.
For finance teams using Power BI, Tableau, or Looker, the guide to automating Power BI reports covers the mechanics of setting up that connection in detail.
Step 5: Set schedules, distribution rules, and a review step
Define who gets each report, in what format, and when. The P&L summary goes to the CFO on the 3rd of each month. The weekly KPI deck goes to ops leadership every Monday. Board materials go out 48 hours before each meeting.
Think about format deliberately. Executives often want a PDF they can open without logging in. Internal team reports work well as live links to refreshable decks. Getting this wrong means reports sit unread.
Build a human review step into the workflow before any report goes to an external recipient or to the board. Automation handles the assembly; a named person should still approve before delivery. This is where the controls layer intersects with the scheduling layer. Slow or missed delivery worsens decision latency. The longer the gap between data being ready and the right person seeing it, the more value the report loses.
Step 6: Test against a historical cycle
Before relying on automated financial reports for a live close, run the automation against the prior month's data. Verify every number ties. Check formatting. Confirm distribution went to the right people. A formatting error caught in a test run is a minor fix. The same error in a live board deck is not.
For more on governance and access controls in report automation, including who should have permissions to create and modify automated reports, that guide covers the full scope.
Controls, governance, and compliance
Automating financial reports without addressing the controls layer is how teams end up with automation that's fast but ungovernable. For finance in particular, where accuracy has real legal and reputational stakes, the controls layer isn't optional.
Approval workflows. For any report going to the board, an investor, or a regulator, automation should handle the assembly, not the approval. Build a named-reviewer step into the workflow: the report is generated automatically, a finance lead reviews and signs off, then it's sent. This is both a compliance requirement in many regulated environments and a practical safeguard against automated errors reaching leadership unchecked.
Version control. Every board deck and investor update should exist in a versioned, dated record. If someone asks six months from now what numbers went to the board in Q3, you should be able to retrieve the exact document. Locking templates also prevents well-meaning people from editing a personal copy, which is where version drift starts.
Role-based access. Separate who can edit templates from who receives outputs. Finance leads and BI developers should be able to modify report templates; stakeholders should receive outputs. Blurring this line is how unauthorized formatting changes and data modifications enter the reporting chain.
Audit trail. A compliant reporting process should answer: which data populated this report, from which source system, on which date, and who approved it before it went out? Manual processes rarely have clean answers to all four. A well-implemented automated workflow does.
Change management for KPI definitions. When a metric definition changes (say, the company redefines ARR or switches from gross to net revenue), every template using that metric needs to be updated and re-validated. In a manual process, it's common for one deck to get updated while another runs another cycle on the old definition. A governed template system makes metric changes a controlled event, not a fire drill.
Implementation challenges
Financial reporting automation is not a one-click implementation. The teams that struggle most underestimate a few predictable obstacles.
Data quality is a prerequisite. Automation amplifies whatever is in the source data. If the GL has miscoded transactions or the FP&A tool has stale actuals, the automated report will be wrong at scale, and wrong faster than the manual process would have been. Resolve data quality issues before automating, not during.
Template standardization requires organizational buy-in. Once a template is locked, changing it is a controlled process. Finance teams used to adjusting layouts and chart types on a per-cycle basis will push back. This is a change management problem as much as a technical one. Get agreement on the template before locking it.
Multi-entity consolidation adds setup complexity. A single-entity P&L report can often be automated quickly. Multi-entity consolidation with intercompany eliminations, currency conversions, and entity-level reporting adds real complexity. Budget time accordingly.
Not everything should be automated. Ad-hoc analysis, scenario modeling, and qualitative board commentary still require human judgment. Trying to automate narrative text alongside data is a common mistake. The data automation is reliable; the narrative needs a person.
Financial reporting automation readiness checklist
Before implementing financial reporting automation, use this to confirm your foundation is in place. Missing items won't prevent you from starting, but they will slow you down.
Data foundation
- [ ] Each recurring report has a clearly identified authoritative data source, not "it depends on who's pulling it"
- [ ] Source data matches across systems: numbers in the GL tie to numbers in the BI dashboard
- [ ] Data lives in a governed system, not in personal Excel files on someone's laptop
Template and process foundation
- [ ] At least one recurring report has a locked, approved template that is consistent cycle-to-cycle
- [ ] The distribution list for each report is documented: who gets what, in what format, when
- [ ] A named reviewer is identified for each report before it goes to the board or external recipients
Controls foundation
- [ ] Version control is in place for board and investor-facing templates
- [ ] Role-based access is defined — who can modify templates, who receives outputs
- [ ] The review and approval step is documented and will survive staff changes
Testing
- [ ] The automation has been tested against at least one historical cycle before going live
Tools for financial reporting automation
No single tool handles the full cycle. Financial reporting automation is a stack problem, and understanding where each layer stops is what helps you identify the gaps.
ERP and FP&A tools: the data layer
ERPs (NetSuite, SAP, Oracle) are where GL data lives. They all have native reporting: formatted P&L exports, standard financial statements. A common limitation is rigid output formats, manual distribution, and no direct connection to a board-ready slide template.
FP&A tools (Adaptive Insights, Anaplan, Pigment, Mosaic) are built for budget vs. actuals, forecasting, and planning. Their native reporting is strong within the platform. Getting that analysis into a formatted board deck still requires exporting and reformatting.
BI tools: the analytics layer
Power BI, Tableau, and Looker handle aggregation, visualization, and live data refresh well, and all three support some form of scheduled delivery: email snapshots, PDF exports, links to live views. Native BI delivery gets content out; it doesn't create a governed board-deck workflow with locked templates, approvals, and archival history.
For a comparison of what automated reporting tools handle at each layer, that breakdown is useful alongside this guide.
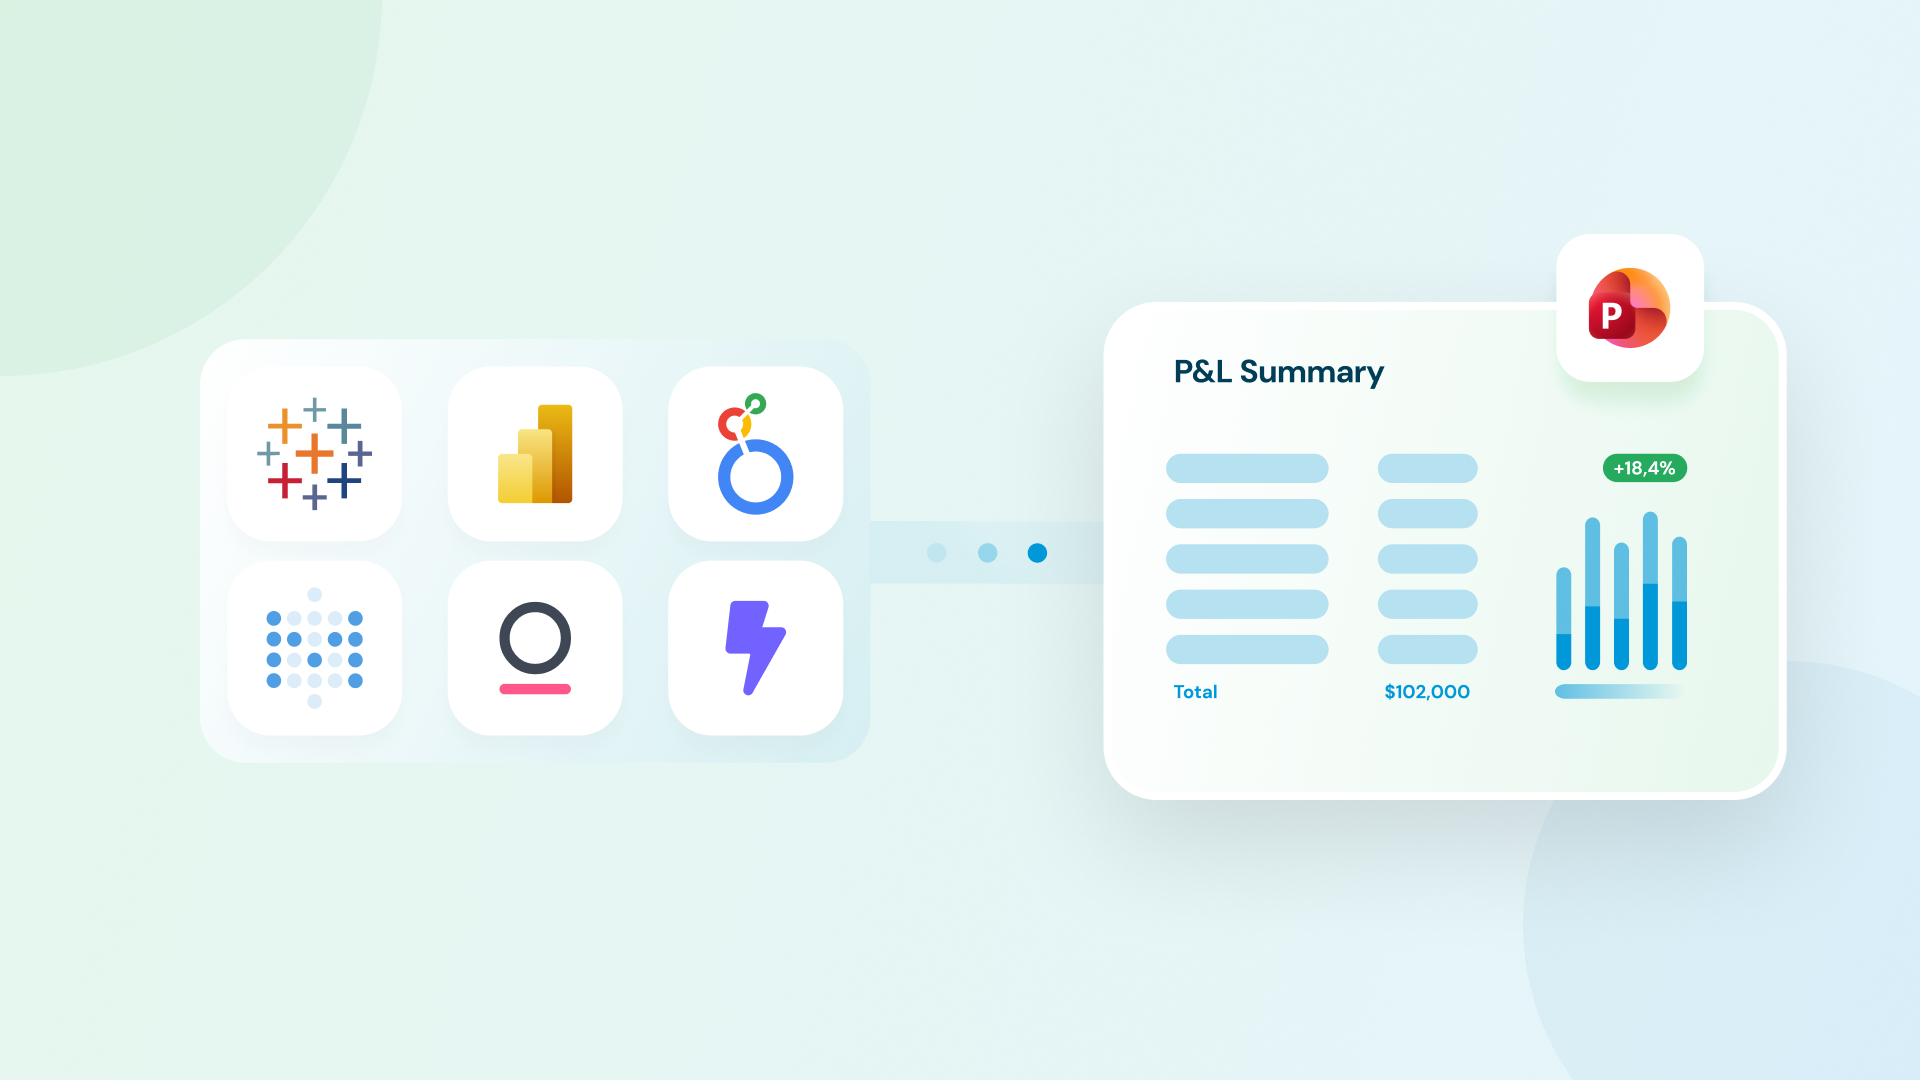
The delivery layer: how Rollstack takes data to formatted, governed output
This is the layer many finance teams still handle manually. The data is clean and governed in the BI tool. The board wants a PowerPoint. Someone has to bridge that every cycle.
Rollstack is built specifically for this layer. It connects directly to Power BI, Tableau, Looker, and other BI sources, maps live data to locked slide templates, and schedules automatic refresh and distribution. The finance team doesn't export anything. For multi-entity reporting or board packages with individual appendices, Collections handles multi-recipient delivery from a single template, with version control and a delivery audit trail that connects directly to the controls requirements above.
SoFi's finance team cut report prep from six hours to 45 minutes per reporting cycle after automating their financial reporting workflow with Rollstack. (Full case study.)
For a broader look at reporting automation at the enterprise level, including scaling this across multiple teams, that guide covers the full scope.
Conclusion
Financial reporting automation pays off when you treat it as a full-cycle problem. The data layer (ERPs, FP&A tools, BI dashboards) is where most finance investment has gone. The last mile of reporting is still where many finance teams lose time every close cycle.
Fix the delivery layer, build the controls in from the start, and the close stops being a team-wide exercise every month. The teams getting the most out of automated financial reporting aren't the ones who enabled every feature on day one. They're the ones who cleaned up their data sources, locked their templates, and built the governance layer before the automation ran live.
If the delivery layer is still the gap (the part where someone manually exports from BI and rebuilds the deck), see how Rollstack handles it →
FAQ
What is financial reporting automation? Financial reporting automation is the use of software to automate recurring financial reporting tasks, including data collection, validation, consolidation, report generation, and distribution. It covers the full cycle from pulling data out of source systems to getting a formatted report into stakeholders' hands (not just dashboard refresh).
What are the benefits of financial reporting automation? The main benefits are time savings on recurring close work, fewer errors from manual handoffs, faster delivery to stakeholders, a defensible audit trail, and the ability to scale report production without scaling headcount. For most finance teams, the largest time savings come from automating the distribution and formatting steps that happen after the data is ready.
Which financial reports can be automated? Any report that recurs on a fixed schedule, pulls from the same data sources each cycle, and follows a consistent format is a good candidate: P&L statements, budget vs. actuals, cash flow reports, board materials, management dashboards, and compliance filings. Ad-hoc analyses and reports requiring qualitative judgment are not good automation candidates.
What tools are used for financial reporting automation? Financial reporting automation typically involves a combination: ERP systems (NetSuite, SAP, Oracle) for GL data, FP&A tools (Adaptive Insights, Anaplan, Pigment) for planning and variance analysis, BI tools (Power BI, Tableau, Looker) for dashboards and analytics, and a delivery layer that connects the BI tool to formatted slide templates and handles scheduled distribution and governance.
What's the difference between financial reporting automation and BI dashboards? BI dashboards refresh data automatically but require stakeholders to log in and view them. Financial reporting automation pushes formatted reports (PowerPoint decks, PDFs, documents) directly to stakeholders on a schedule. All major BI tools support some form of scheduled delivery. Finance teams often need an additional layer for locked presentation templates, governed distribution, and version archiving. That's the gap the delivery layer fills.
What are the biggest implementation challenges? The most common issues are data quality problems that get amplified at scale, resistance to locked templates from teams used to per-cycle customization, and the complexity of multi-entity consolidation. Change management (getting the team to work through the automation rather than around it) is often harder than the technical setup.
How long does it take to implement financial reporting automation? It depends on complexity. A straightforward P&L delivery from Power BI to a slide template can often be configured in under a week for a team with a clean data source and an existing template. Multi-entity consolidation, compliance-grade audit trails, and multi-recipient delivery at scale take longer. The setup is front-loaded: once templates and connections are configured and tested, subsequent cycles run automatically.
How does financial reporting automation help with compliance? Automated financial reports create a consistent, reproducible process with an audit trail: you can trace which data populated which report, on which date, and who approved it. For regulated industries, this is a material improvement over manual processes, which typically have no clear audit trail. Version control and role-based access in the automation layer also prevent unauthorized modifications from reaching stakeholders.
If someone on your team is still manually exporting from your BI tool and rebuilding the board deck every close cycle, that's a delivery problem, not a data problem.
Rollstack connects Power BI, Tableau, and Looker directly to locked slide templates and handles the rest: refresh, format, deliver on schedule. SoFi cut their reporting cycle from 6 hours to 45 minutes.
See it in action →
Save 82% more time on your financial reporting cycles with Rollstack
Connect your BI tools directly to slides, docs, email templates and more. Leverage your existing dashboards to update 100s of presentations on a schedule, saving your team hours of manual work.
See it in action →
Ready to close the gap between your BI tool and the board deck?
See how finance teams automate the full delivery layer: from governed BI data to formatted, distributed board materials, without manual exports.